Longing Bitcoin Cash at this zone can bag you profits

Once a regular top 10 cryptocurrency, Bitcoin Cash has fallen slightly down the pecking order. Its year-to-date gains of 38% seemed pale when compared to its larger counterparts- some of which have seen percentage growth in triple digits.
Nevertheless, BCH’s correlation with BTC has historically remained strong and the digital asset has been quick to respond to bullish and bearish cues emanated by the king coin. Similarly, BTC’s recent drop from $39,500 triggered a correction for BCH as well which moved towards a strong defensive zone. At the time of writing, BCH traded at $480.2, down by 5.5% over the last 24 hours.
Bitcoin Cash 4-hour chart

Source: BCH/USD, TradingView
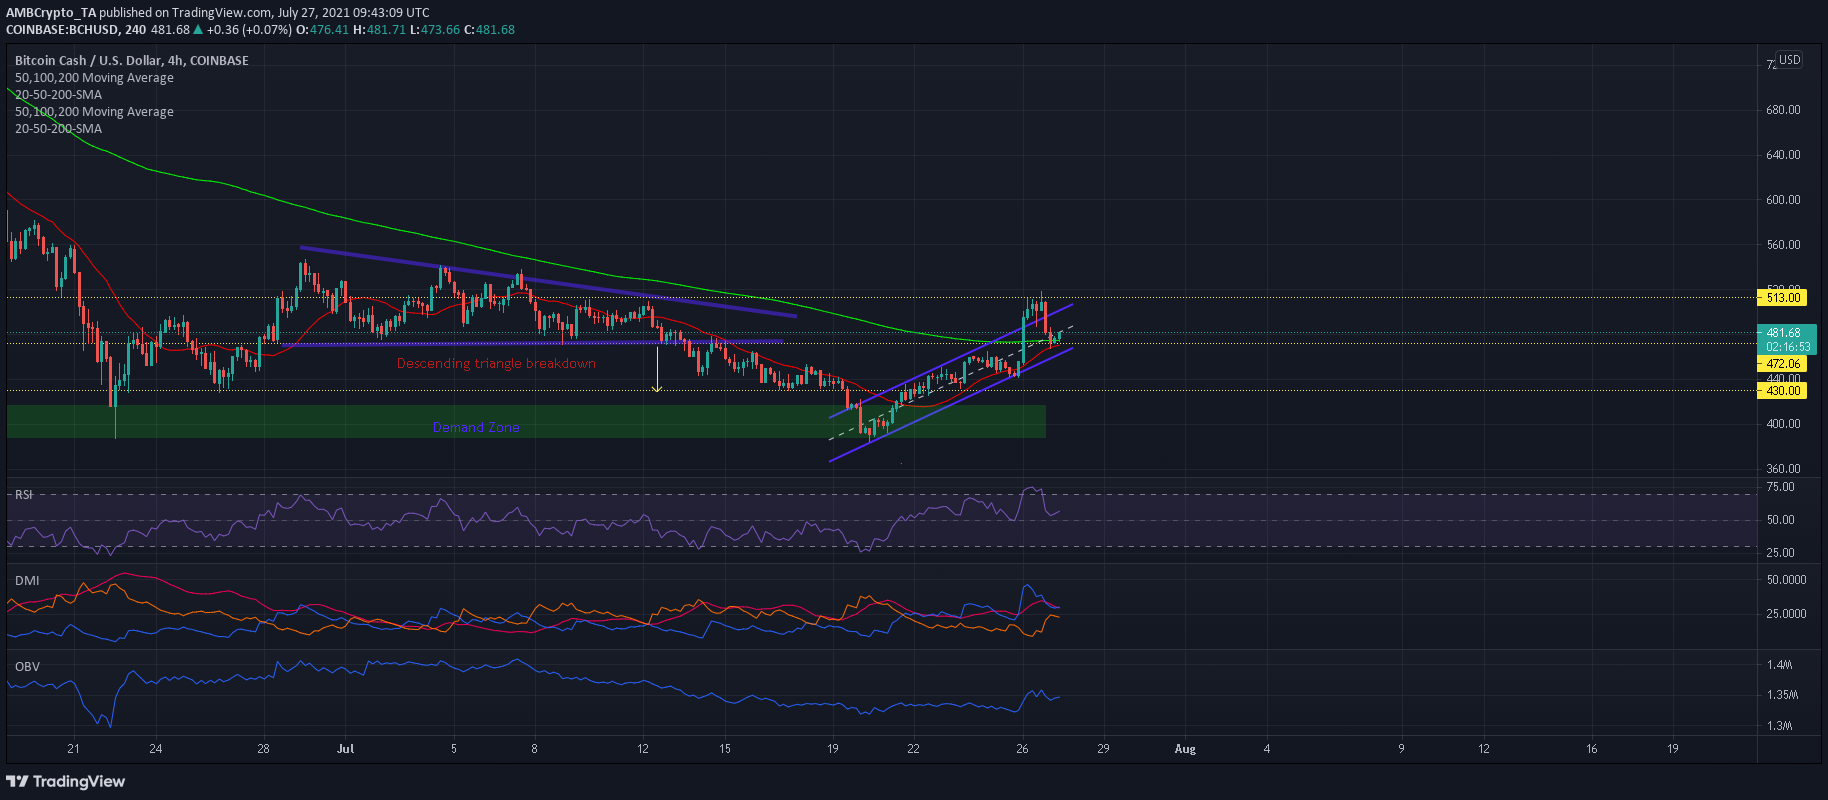
BCH’s decline on 22nd June and subsequent rally led to the emergence of a new demand zone between $387-417. The region was called into action a week ago and successfully triggered another uptrend for BCH as prices eventually broke north from their ascending channel. However, BCH failed to sustain this breakout and prices moved back within the confines of the pattern.
Key support zone to trigger rebound?
The spotlight now moved to a defensive zone of $470-475 and a bullish argument can be made if losses are maintained above this region. Previously, a fall below this area led to a 7% decline on the back of a descending triangle breakout.
This time around, the area some saw a confluence between the 20-SMA (red) and 200-SMA (green) which bolstered its defensive capabilities. If bulls avoid a close below this level, the next upcycle would likely be initiated in the next 24 hours. Conversely, a sharper retracement could drag prices towards the next support available at $460.
Reasoning
The Relative Strength Index declined from the overbought zone but found support at 50-55 which was a sign of bullish strength. Although the Directional Movement Index’s lines converged, a bullish trend was still active as the +DI maintained above the -DI. The OBV also registered a slight uptick as buying pressure outweighed selling pressure.
Conclusion
The above mentioned signs indicated that bullish control would resume over the coming sessions and a hike towards $513-515 can be expected in the best-case scenario. Meanwhile, traders can long opt to BCH at its current price level as a decline below $470-475 and exit their positions once the upper ceiling is snapped.

![Why Chainlink [LINK] and Polygon [MATIC] are more similar than you realise](https://ambcrypto.com/wp-content/uploads/2024/04/Chainlink_and_Polygon-1-400x240.webp)


