Looking into whether PEPE’s 35% gains will last through April
The lower timeframe market structures were still bearish for PEPE, but momentum has begun to shift.

- PEPE maintained a long-term bullish structure, but has a short-term bearish structure.
- The momentum and volume indicators showed a bullish reversal was underway.
Pepe [PEPE] maintained a bullish market structure on the higher timeframe charts. It has not fallen to a key demand zone where prices consolidated during the early March rally.
The recent bounce in prices also buoyed market sentiments.
A recent AMBCrypto report highlighted the falling supply in profit as prices fell, alongside a drop in trading activity.
The addresses in profit were still at a healthy number — will this see prices rebound, or should investors prepare for an extended consolidation phase?
The consolidation and reversal at the 61.8% retracement
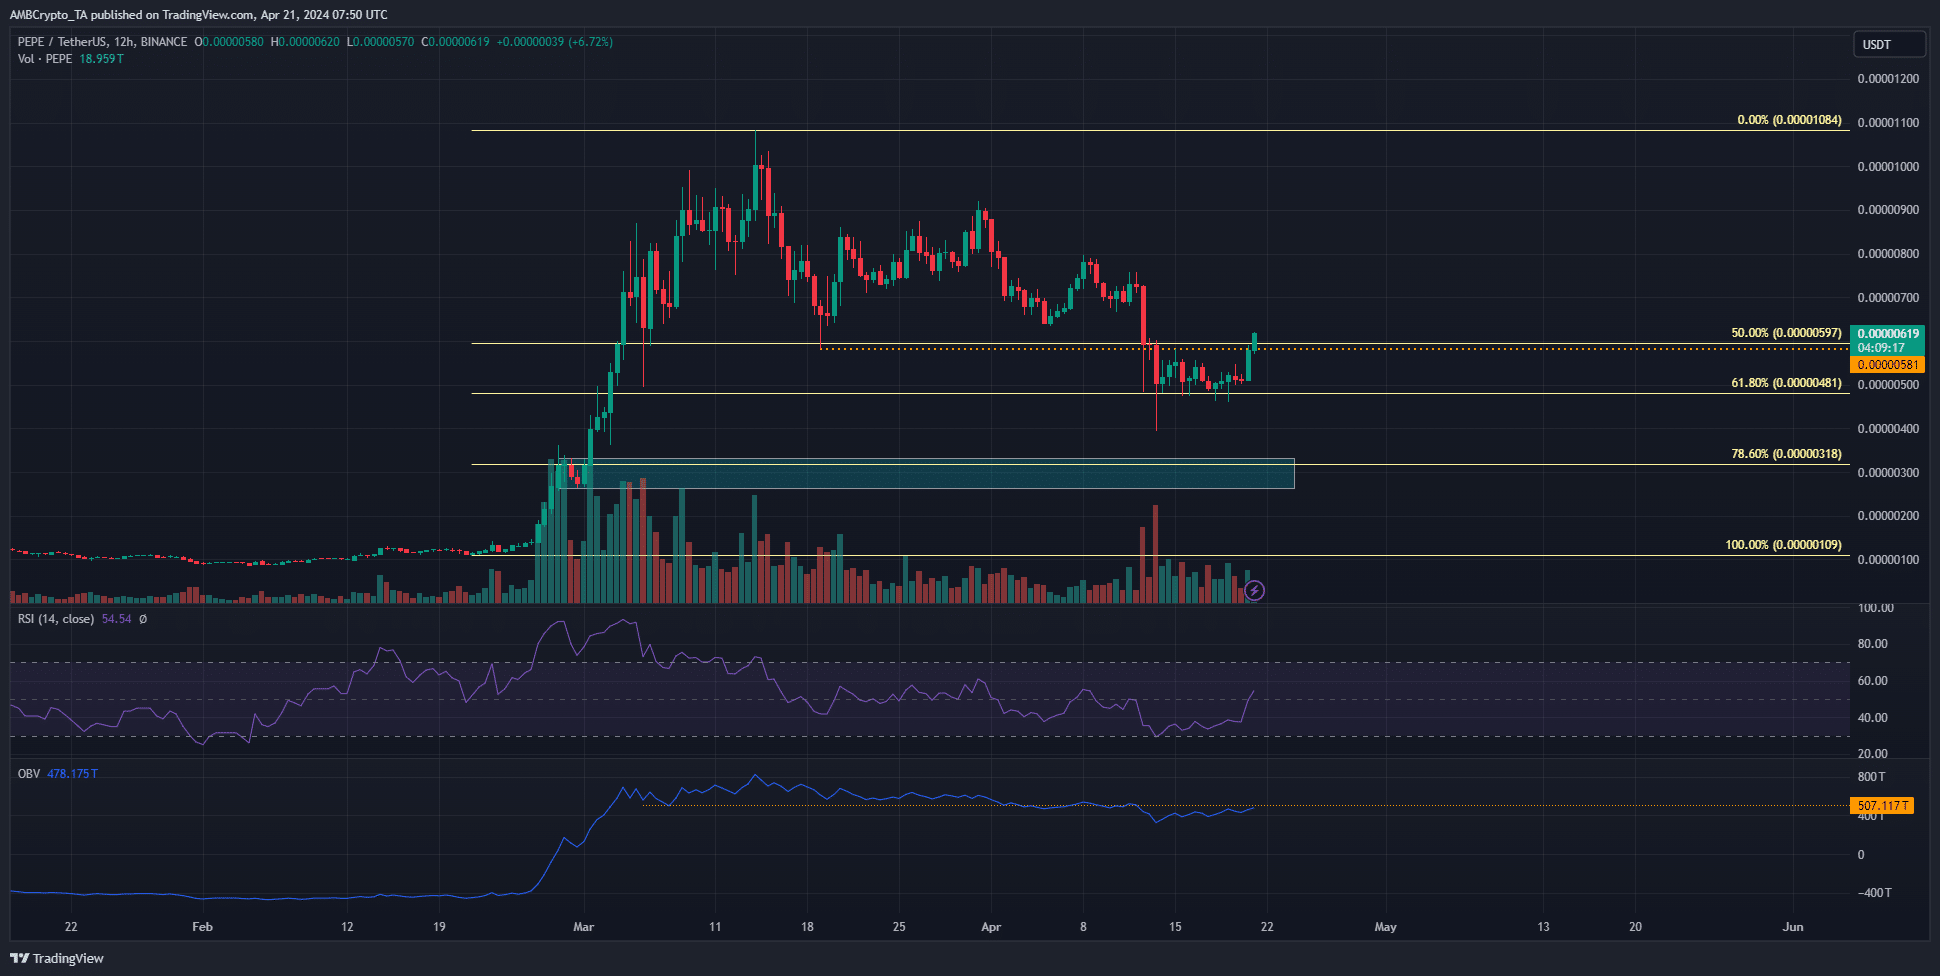
PEPE has made gains of 34.9% since the 19th of April’s lows. This bounce also took prices above the low at $0.00000581.
While the $0.000006-$0.000007 region is a resistance, the bulls have some strength to flip it to support.
For starters, despite the month-long downtrend on the OBV, it has begun to make higher lows in the past week. It was not much, but it was a good start.
Another factor was the RSI on the 12-hour chart climbing above neutral 50, giving an early signal of bullish momentum.
The lower timeframe market structure such as 4-hour and lower was still bearish. However, the defense of the 61.8% Fibonacci retracement level at $0.00000481 in the past week was an encouraging development.
If the OBV can climb back above the dotted line plotted, it would be another early sign of bullish impetus.
The next magnetic zone for PEPE prices
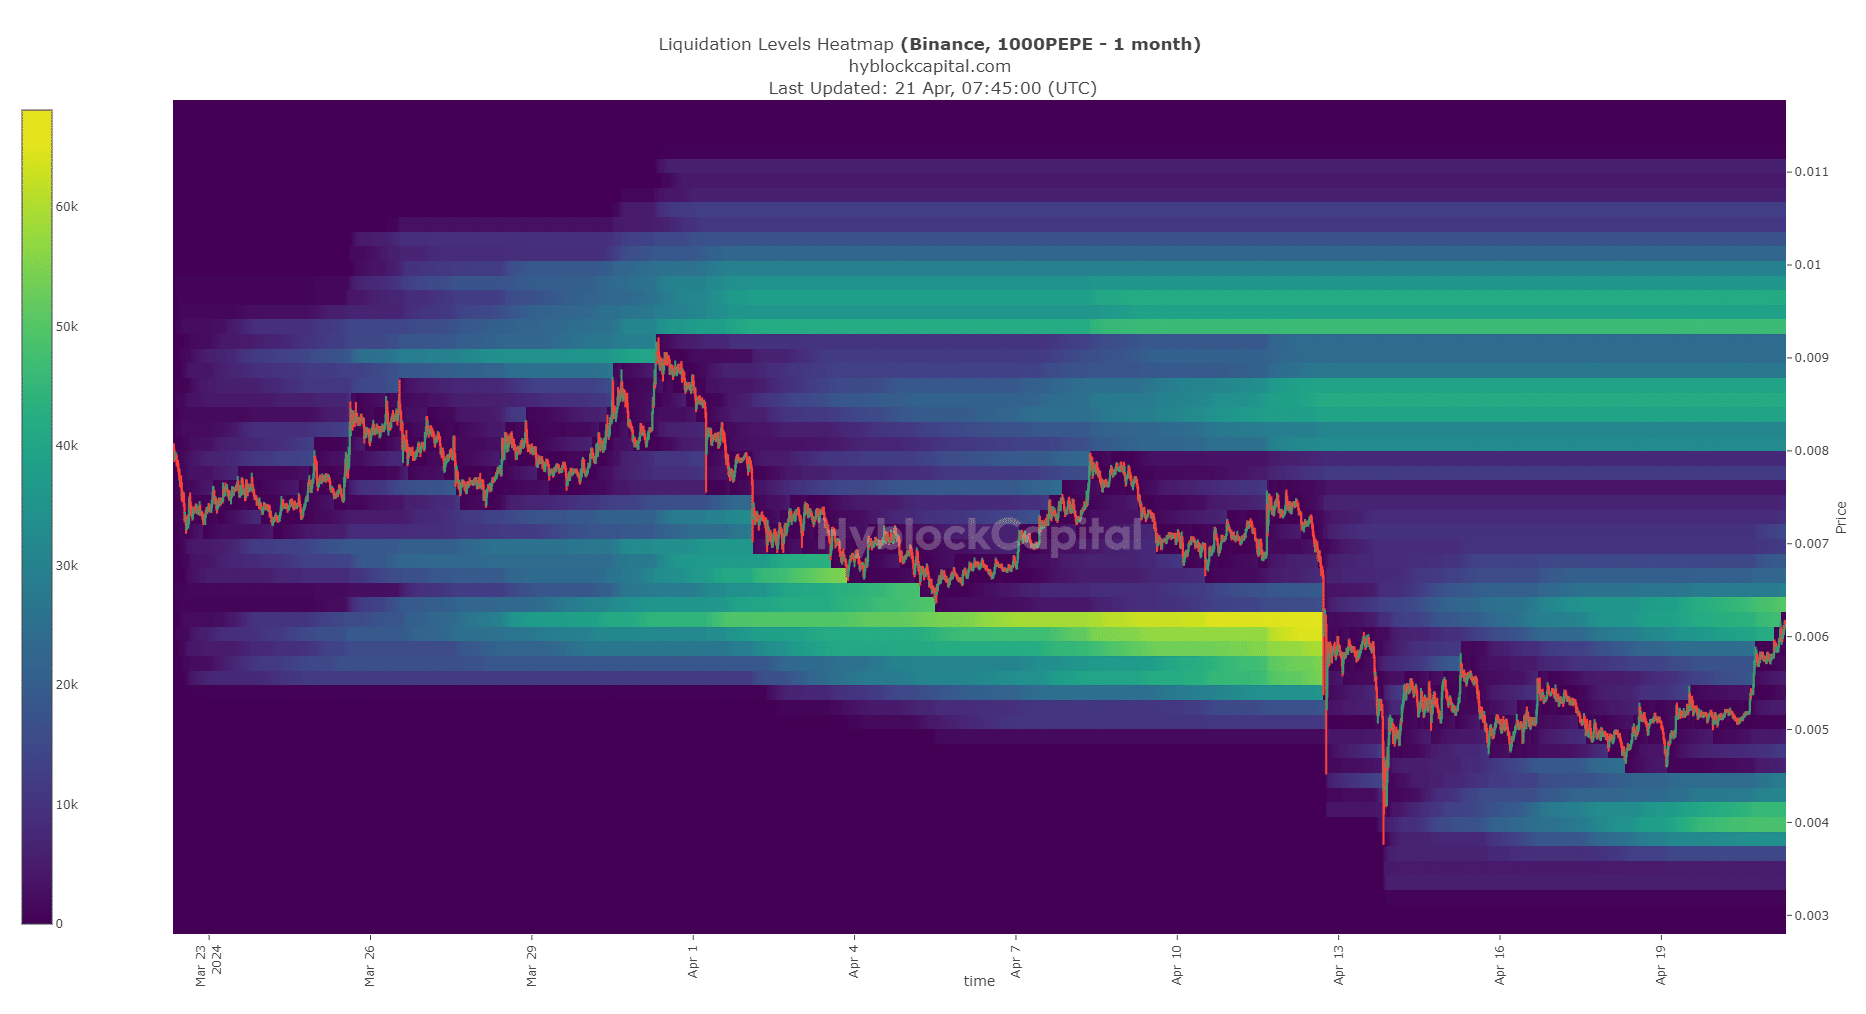
The $0.000006-$0.000007 was a resistance zone from both a technical perspective and from the liquidation heatmap.
Is your portfolio green? Check out the PEPE Profit Calculator
The cluster of liquidation levels at $0.0000065 was about to be swept, which could force prices higher.
The next areas of interest are at $0.000004 and $0.0000084. If PEPE is unable to break its short-term bearish structure soon, traders might have to be prepared for another move lower.
Disclaimer: The information presented does not constitute financial, investment, trading, or other types of advice and is solely the writer’s opinion.


