Loopring: Why this level has the potential to halt its long-term downtrend

Disclaimer: The findings of the following analysis are the sole opinions of the writer and should not be considered investment advice
There was some fear in the market as Bitcoin hovered around the $40k mark. The stock markets have also not been extremely bullish. In fact, it can be argued that Bitcoin is following in the footsteps of major stock indices and moving sideways in the fast couple of days.
Going back slightly further, the past two weeks has seen a strong pullback on Bitcoin, and Loopring has seen a pullback as well. Yet, on the larger timeframes, Loopring appeared to have halted its downtrend.
LRC- 1 Day Chart
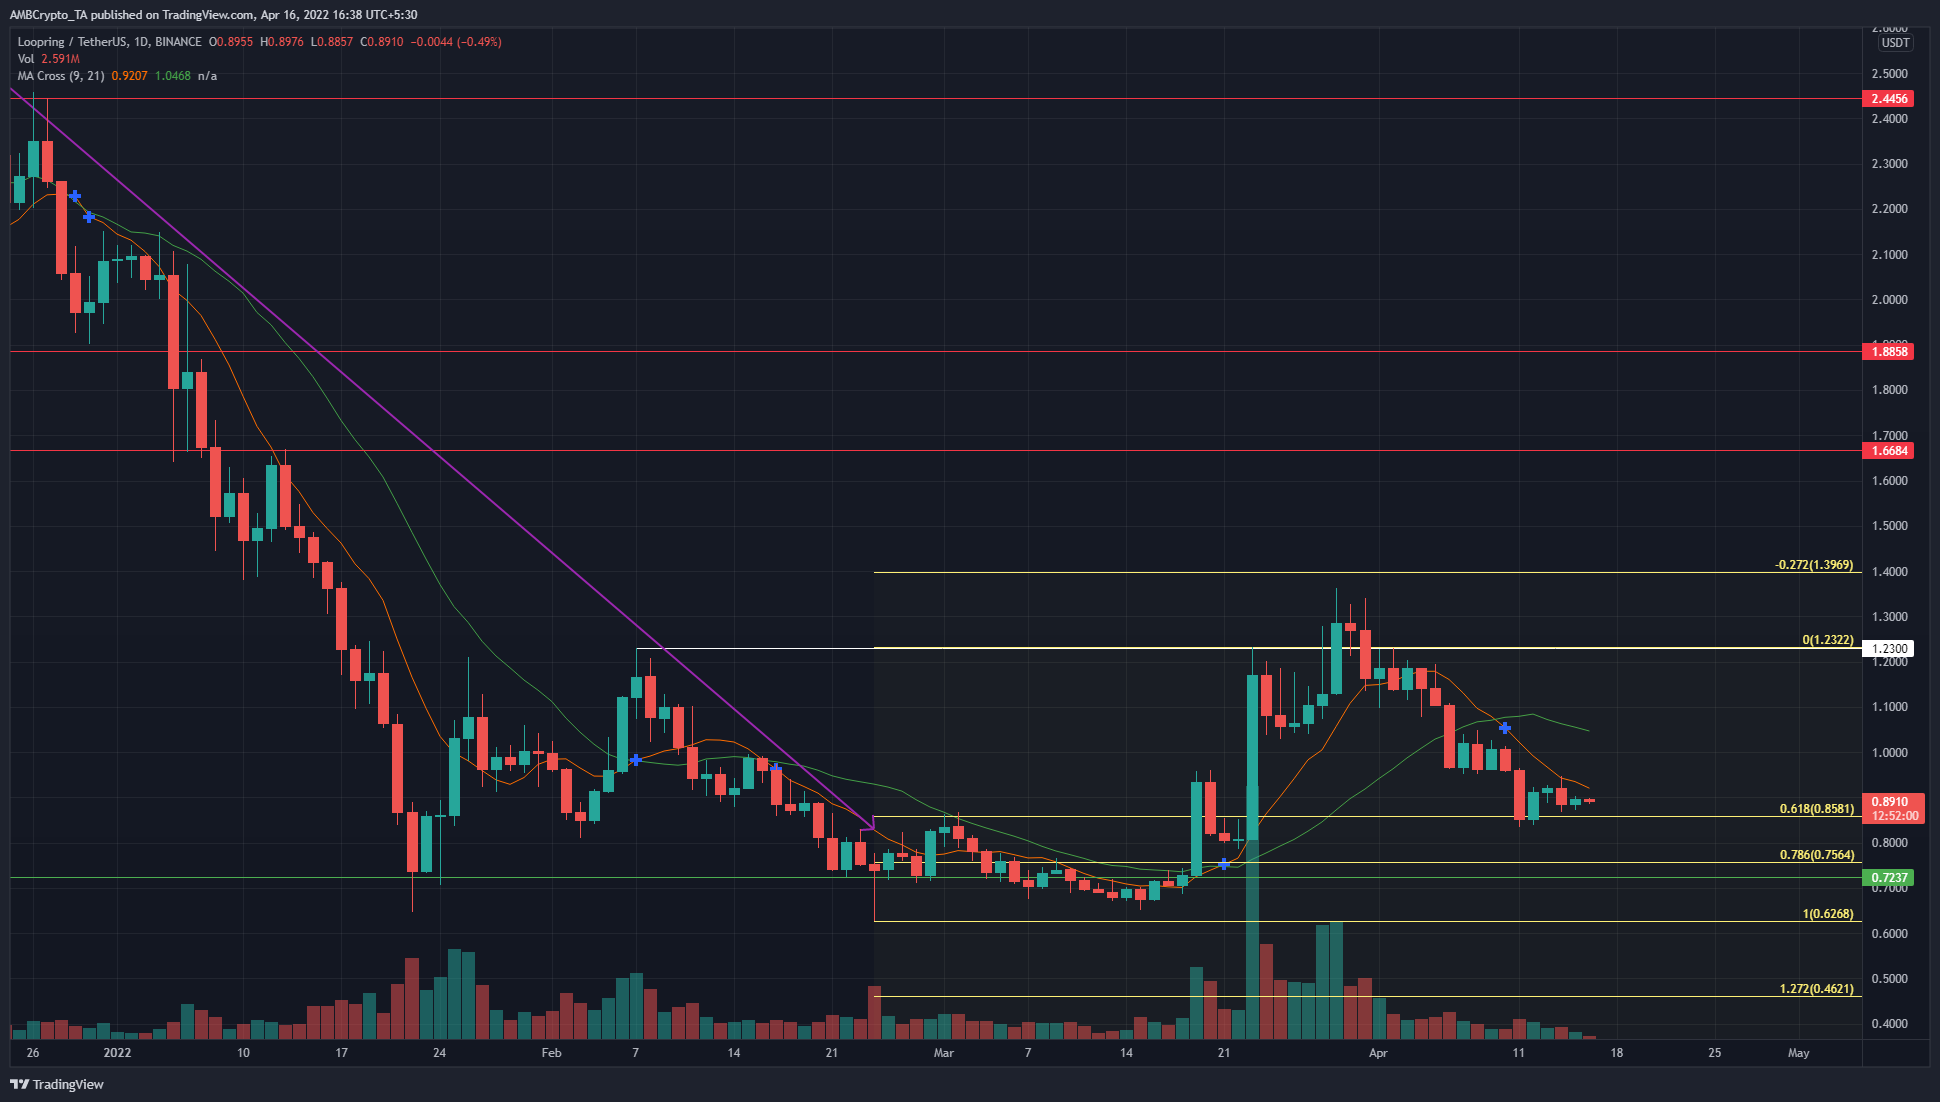
The lower high of the downtrend at $1.23 has been beaten on LRC’s pump toward late March. Following this, it appears that a higher low might also have been set at the $0.837 mark.
Based on LRC’s move from $0.6268 to $1.2322, a set of Fibonacci retracement levels (yellow) was plotted. The 61.8% retracement level at $0.858, and the 78.6% retracement level at $0.756 could be a place where LRC looks for demand before its next leg upward.
The 21-period moving average (orange) crossed over beneath the 55 SMA (green) to denote bearish momentum has taken hold in the past couple of weeks.
Rationale
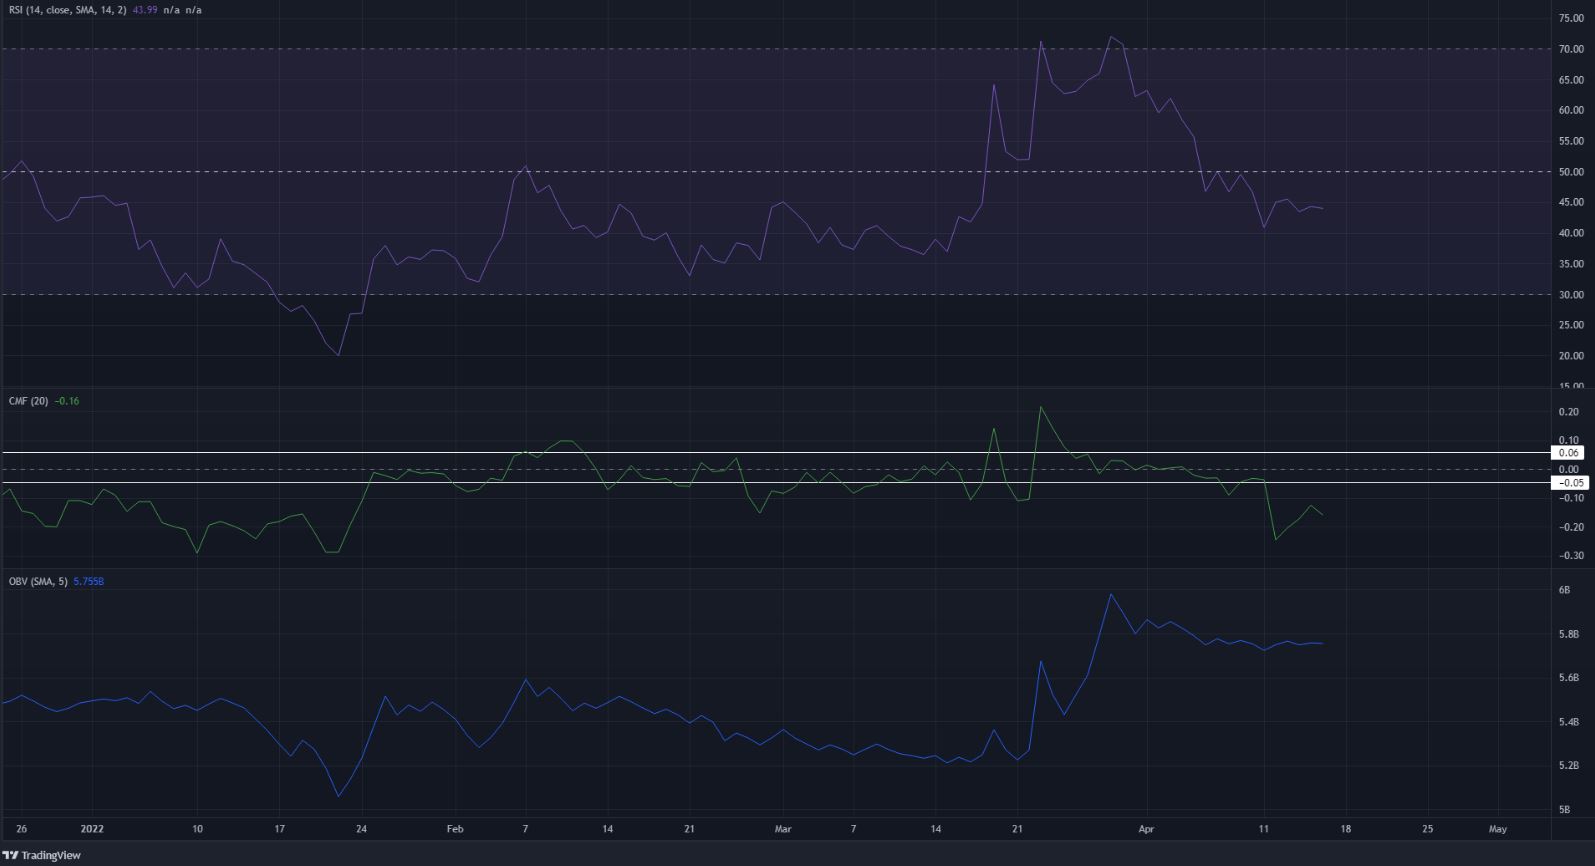
Just as the moving averages showed a shift in momentum toward the bearish side, the RSI also showed a similar development on the daily chart. It slipped below the neutral 50 line, although it did not yet show strong bearish momentum. Nor were any divergences seen.
The CMF dropped well below the -0.05 mark to show strong capital flow out of the market, but this was not indicative of a downtrend. Rather, it was a reflection of the selling pressure of the past ten days.
The OBV has not dropped by a significant amount compared to its run-up in March.
Conclusion
The market structure was bullish as the price broke past the $1.23 mark, and appeared likely to set a higher low in the vicinity of the Fibonacci retracement levels. The momentum indicators were bearish but this was only in response to the pullback.