Losing this level could see Dogecoin drop swiftly to $0.048

Disclaimer: The findings of the following analysis are the sole opinions of the writer and should not be considered investment advice.
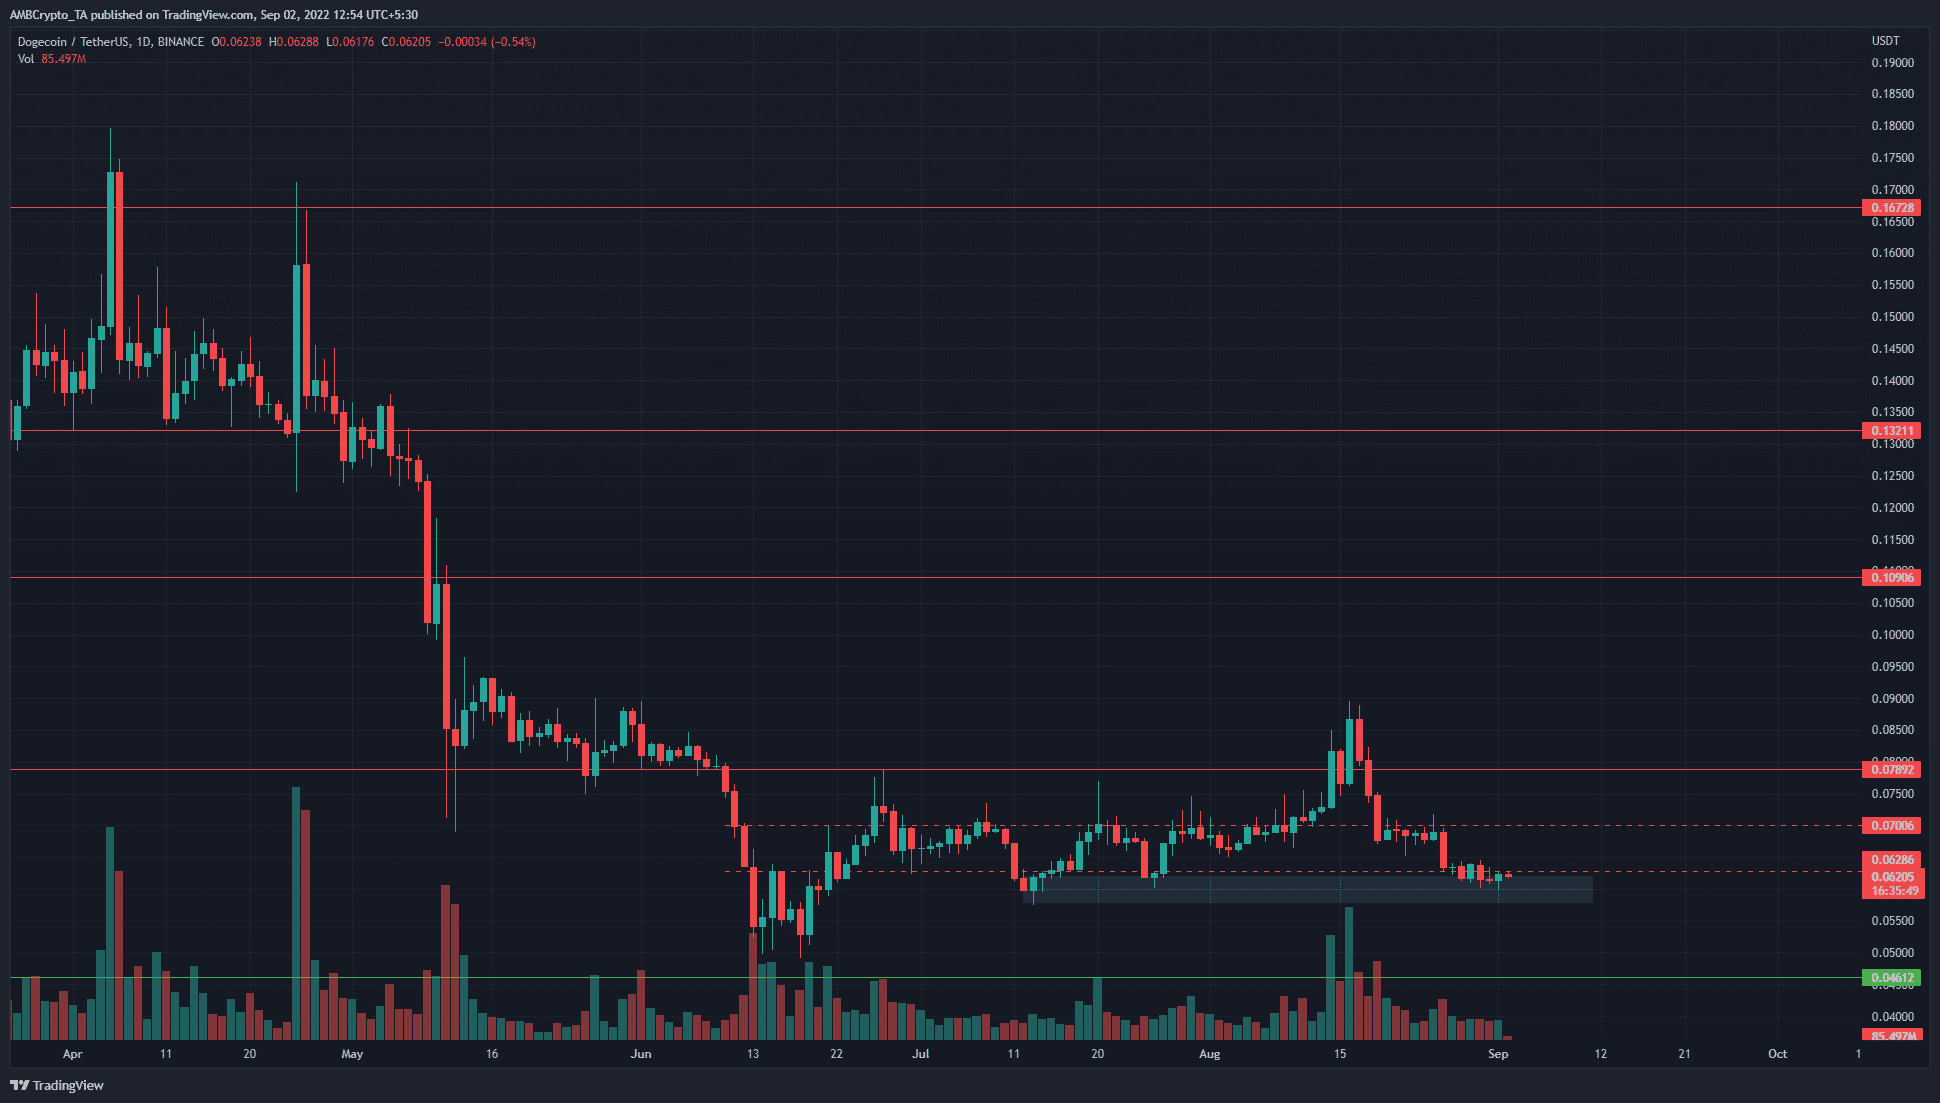
Dogecoin [DOGE] has been in a downtrend since November 2021. The downtrend has been interspersed with swift rallies of double-digit percentage gains. One such rally for DOGE in the past month, when DOGE climbed nearly 50% from the $0.059 low to reach the $0.087 high in August.
At press time, Dogecoin sat precariously in a demand zone. The longer timeframe market structure was bearish for Dogecoin, and Bitcoin showed weakness on the charts as well.
DOGE- 1-Day Chart
The movement of Bitcoin always has a strong impact on the performance of altcoins. Dogecoin and similar meme coins have a tendency of popping off near the end of a Bitcoin rally and crash harder than Bitcoin.
This appeared to have happened in mid-August when BTC’s move to $24k topped out but DOGE still had the stead to push from $0.07 to $0.085.
At press time, DOGE traded at $0.062 and was within a zone of demand from July. Based on price action, a move to $0.07 appeared plausible.
The liquidity in the $0.06 pocket can be tested by another wick downward, but so long as the price does not close a daily session below $0.057, there was a chance of a move upward.
This idea gains some credibility when we consider the fact that July and a good part of August saw DOGE range between $0.063 and $0.07.
Yet, Bitcoin faces stiff resistance at $20.4k and $20.8k. If BTC can climb past these levels, Dogecoin might be able to gather the impetus for a move upward.
Rationale
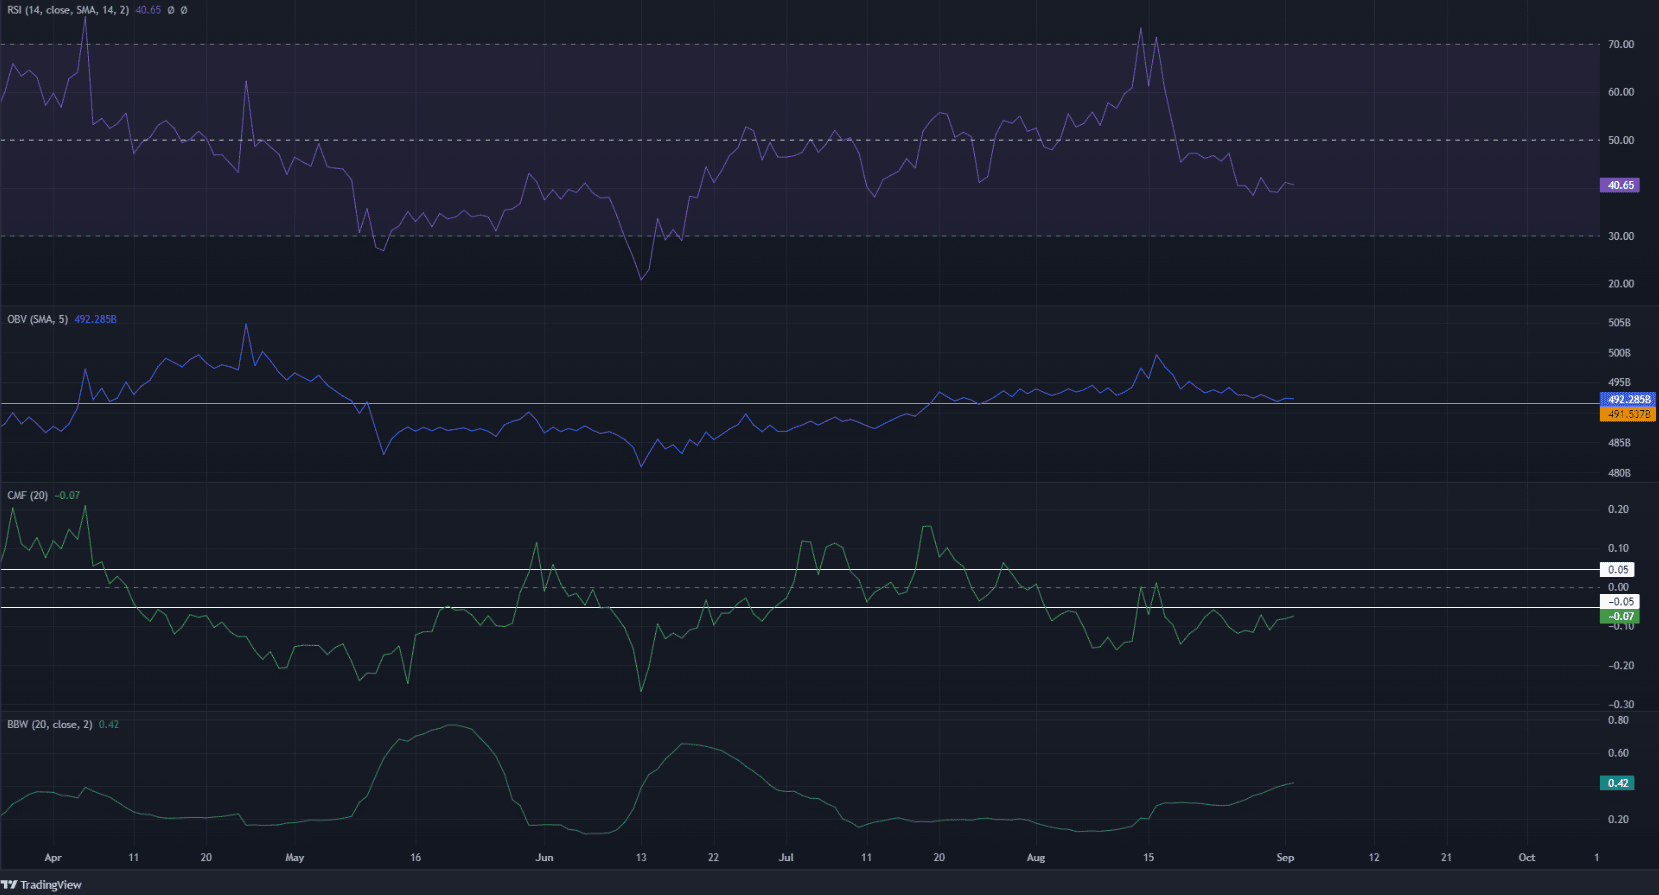
The indicators showed some bearish bias for DOGE. The Relative Strength Index (RSI) slipped beneath neutral 50 in the past two weeks, to highlight bearish momentum on the daily timeframe.
The On-Balance Volume (OBV) did not see a sharp drop. In fact, the OBV also stood at a level of support that has been respected in the past few months. The Chaikin Money Flow (CMF) has shown intense selling pressure throughout August.
The Bollinger Band (BB) Width indicator was also on the rise. The indicator reflects the recent surge in volatility following DOGE’s drop from $0.085.
Conclusion
If the OBV is unable to hold on to the support level in the next week or two, DOGE might be set to witness a sharp drop beneath $0.057. The $0.062 level has been important in February and March of 2021. Losing this level could see DOGE drop swiftly to the $0.048-$0.05 zone.
This downward move hinges on Bitcoin falling on the price charts. The $19.2k-$19.6k is a region BTC bulls would want to see defended.


