LTC averages 1 million transactions but whales are keeping away because…

- Litecoin transaction achieves new average as address activity grows.
- LTC still favors the bears as whales suppress the price action.
Litecoin just reported the robust growth it has achieved in the last few weeks. One key area that has been performing particularly well is its daily transaction count. Unfortunately, this growth has not yet been reflected in its price action.
Is your portfolio green? Check out the Litecoin Profit Calculator
The Litecoin network recently confirmed that it has recently been averaging more than half a million transactions every day. An impressive performance that underscores an increasing adoption pace, as well as healthy network growth.
The #Litecoin network is now effortlessly completing well over half a million transactions per day.https://t.co/oMmXDElB8F pic.twitter.com/alCioudg8o
— Litecoin (@litecoin) May 11, 2023
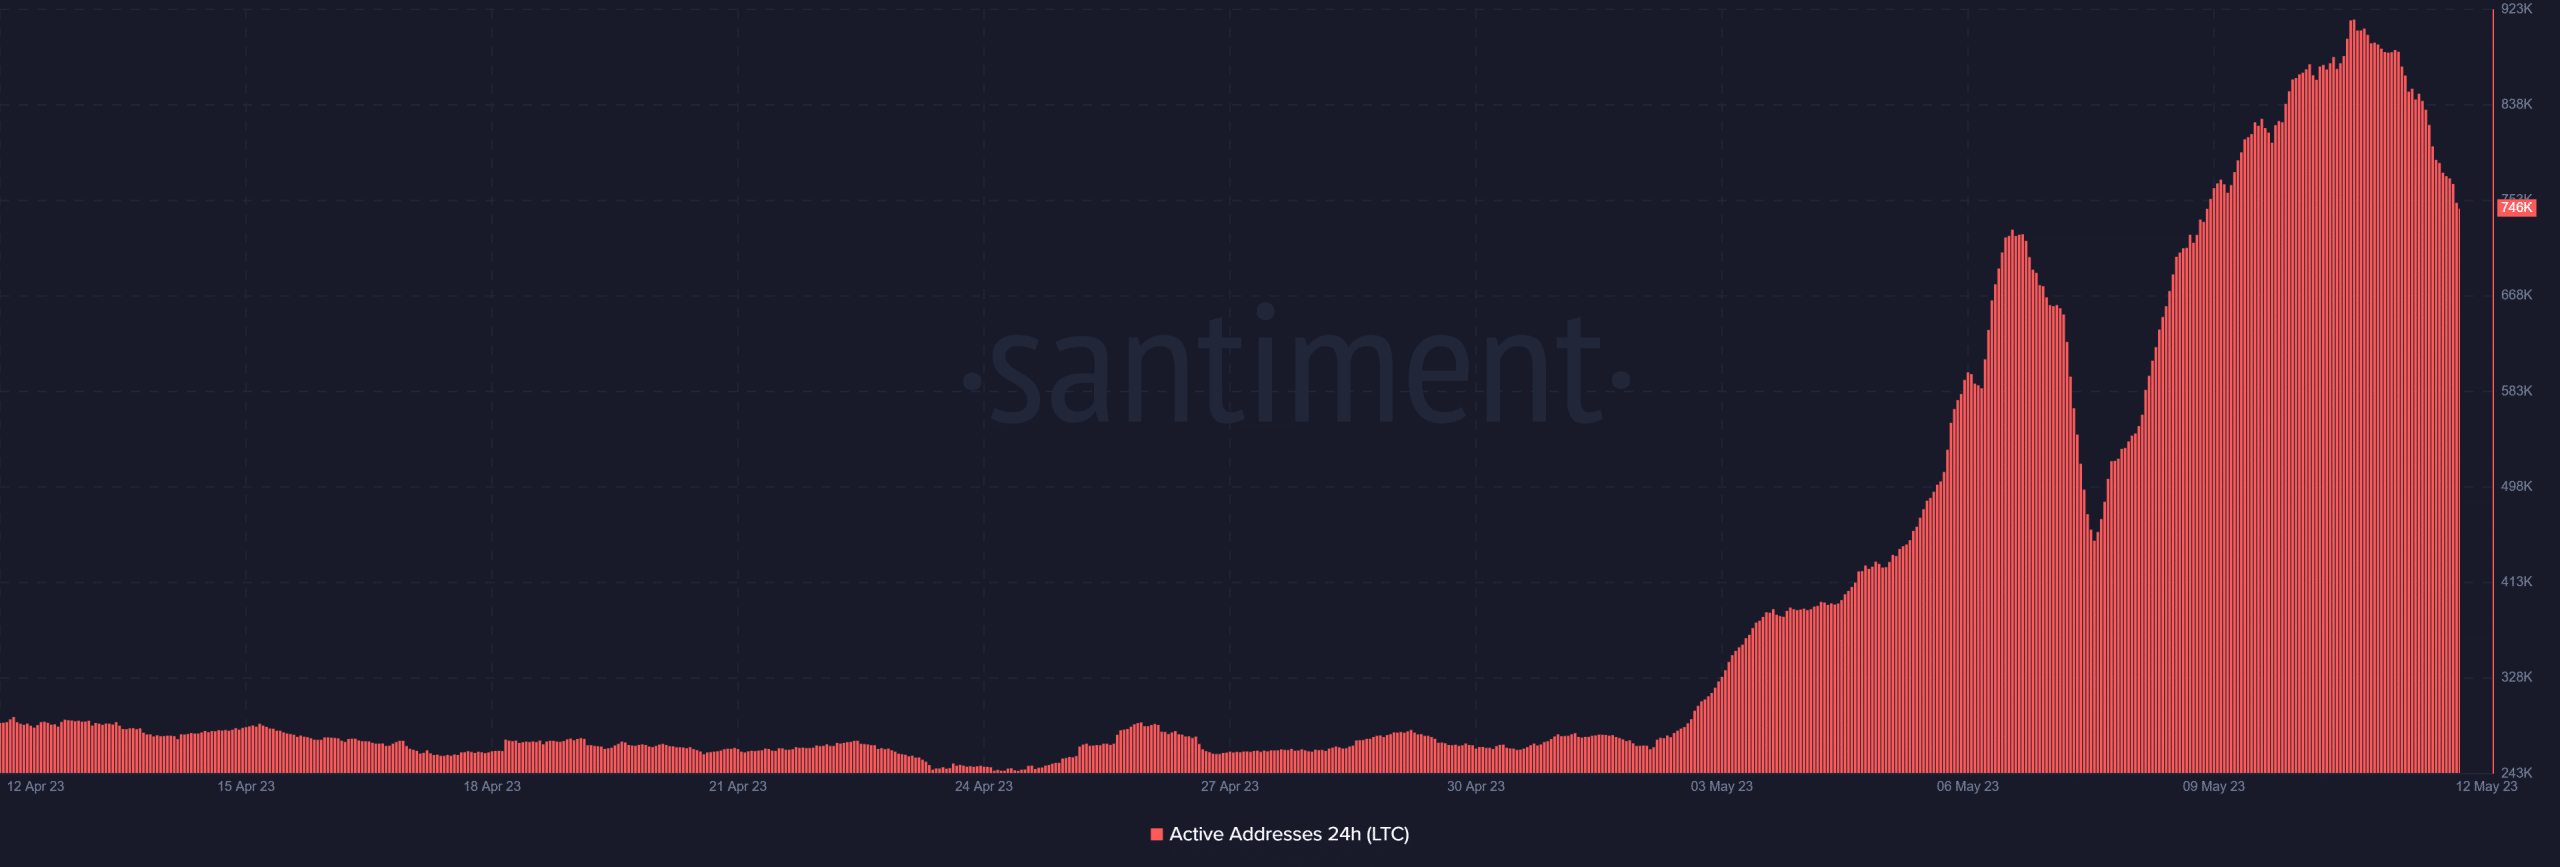
The surge in daily transactions was reflected in the growing number of users on the network. This can be observed in Litecoin’s daily active addresses which have grown substantially since the start of May. To put things into perspective, there were less than 300,000 daily active addresses in April. However, daily active addresses soared to over 900,000 on 10 May.
Are Litecoin bulls shying away from a fight?
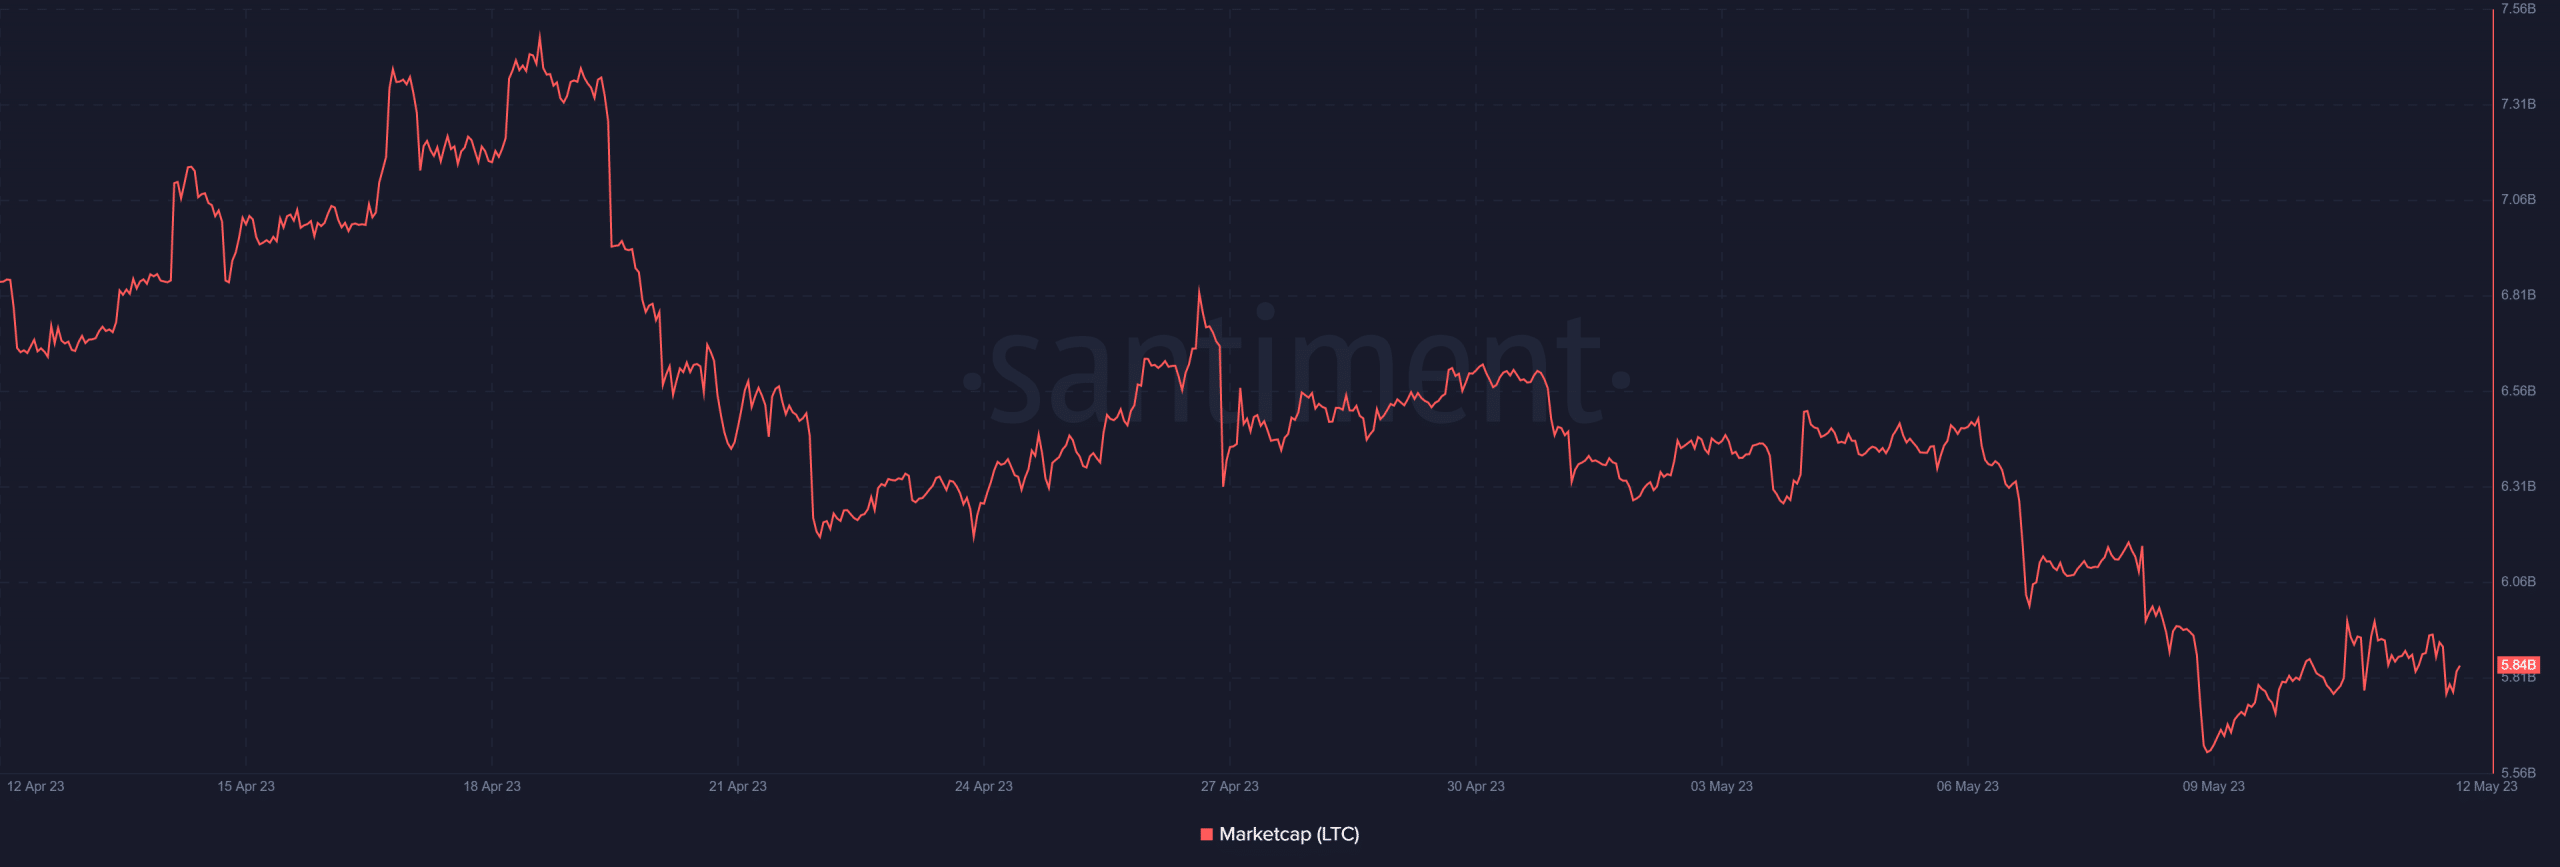
Not all aspects of Litecoin have been enjoying growth. The network’s market cap delivered an inverse performance to address growth. This is contrary to expectations because the address growth usually underscores a surge in demand, or sell pressure.
LTC’s market cap was down by roughly $1.4 billion from its highest level in the last 4 weeks to its lowest level during the same period.
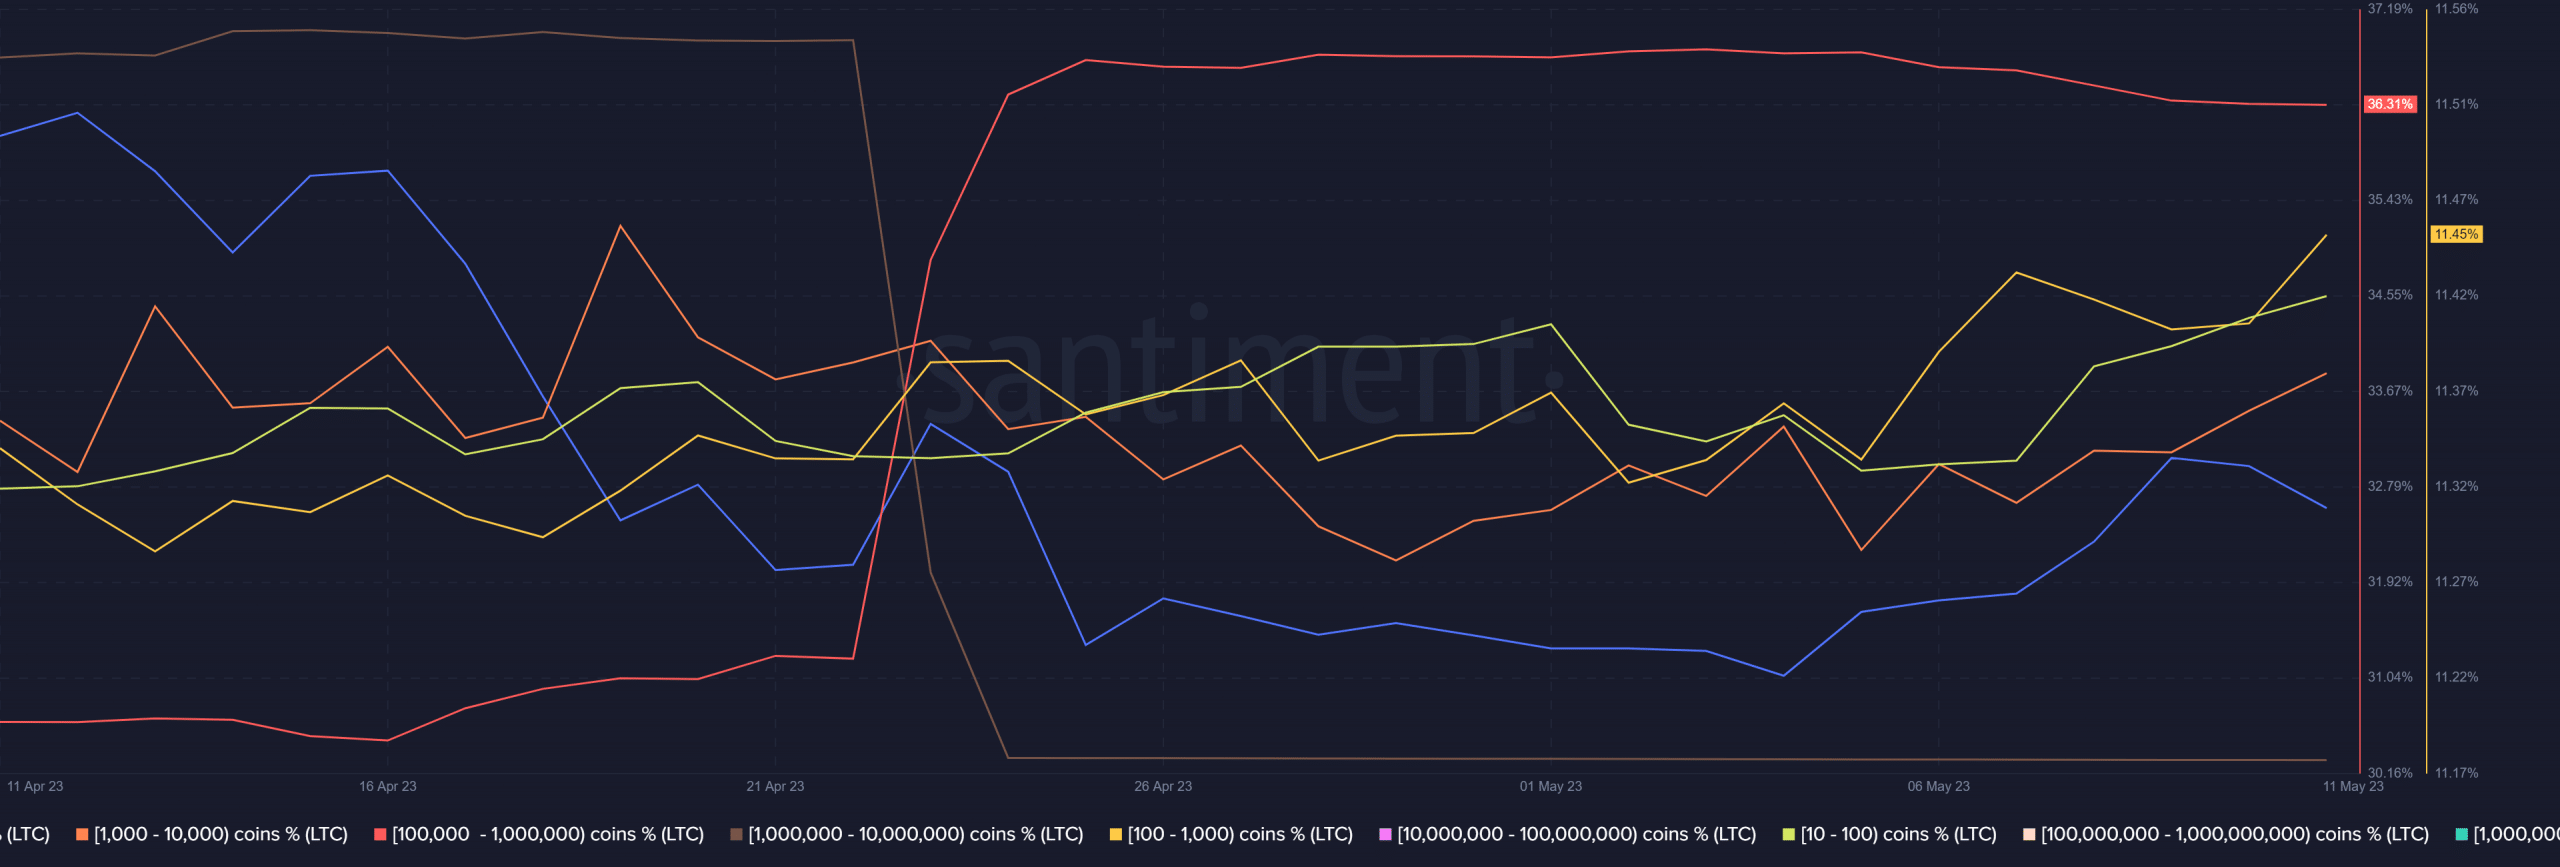
So, why the disparity? Perhaps LTC’s supply distribution may provide valuable insights regarding the differing outcomes. It revealed that most addresses holding between 10 and 100,000 LTC have been buying. Market cap continued extending its downside despite accumulation by those addresses since the start of May.
The sell pressure has largely been coming from the higher categories. These addresses currently control the lion’s share of LTC currently in circulation. As such, they have a more pronounced impact on the market than other the rest of the holders. It explains why recent address growth (Likely retail addresses) failed to reflect on LTC’s price action.
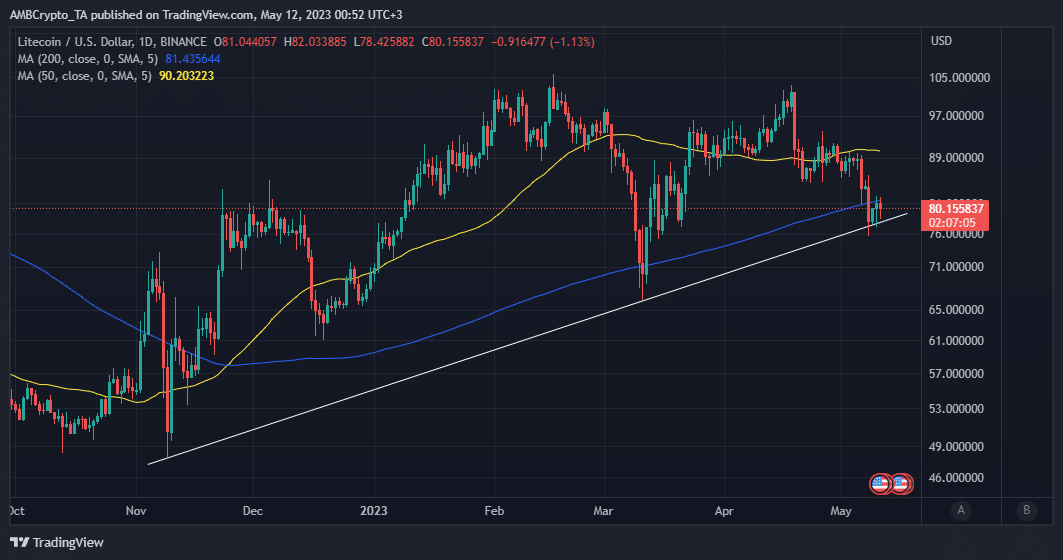
Litecoin traded at $80.15 after slipping below its 200-day moving average. Its latest downside extended on the bearish performance that has prevailed since 9 May.
Read Litecoin’s price prediction for 2023/2024
One key observation on LTC’s price chart was that it had been trading in an ascending price pattern underscored by a support line. The price recently interacted with the same support line after the bearish performance.
The price was already attempting a bounce back from this support line. However, the sell pressure from top whale categories was arguably the main reason why the strong bulls were still at bay.

![dogwifhat's [WIF] 3-day rally has eyes glued, yet a hidden risk lurks](https://ambcrypto.com/wp-content/uploads/2025/04/Gladys-8-400x240.jpg)


