LTC rallies 18% in just over a week but here’s why you wouldn’t want to go long
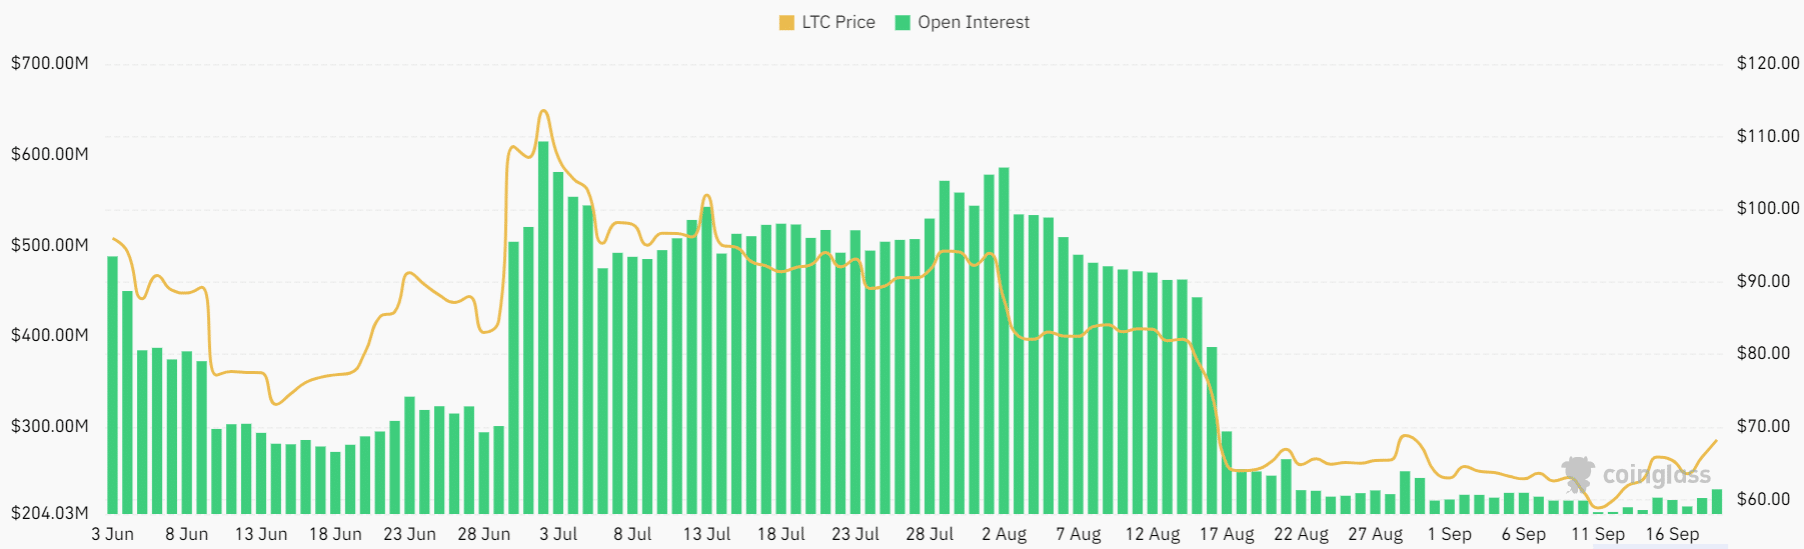
Since late August Litecoin's Open Interest chart has been lackluster. Even when the altcoin bounced from $60 on 12 September the OI refused to budge higher.

Disclaimer: The information presented does not constitute financial, investment, trading, or other types of advice and is solely the writer’s opinion.
- Litecoin maintained its bearish market structure on the one-day chart
- Another rejection was likely based on the lack of buying volume behind LTC
Litecoin [LTC] fell beneath the June low at $70.75 on 17 August. It found support at a Fibonacci extension level and the bulls were able to drive a rally. Yet, the price chart on the higher timeframes did not suggest the buyers were in control.
Is your portfolio green? Check the Litecoin Profit Calculator
Bitcoin [BTC] was trading at $27.4k at press time, and it too witnessed a bounce from a higher timeframe support zone at $25k. Yet, neither BTC nor LTC were trending higher, which meant sellers could wait for opportunities.
The retest of the resistance zone could see another rejection
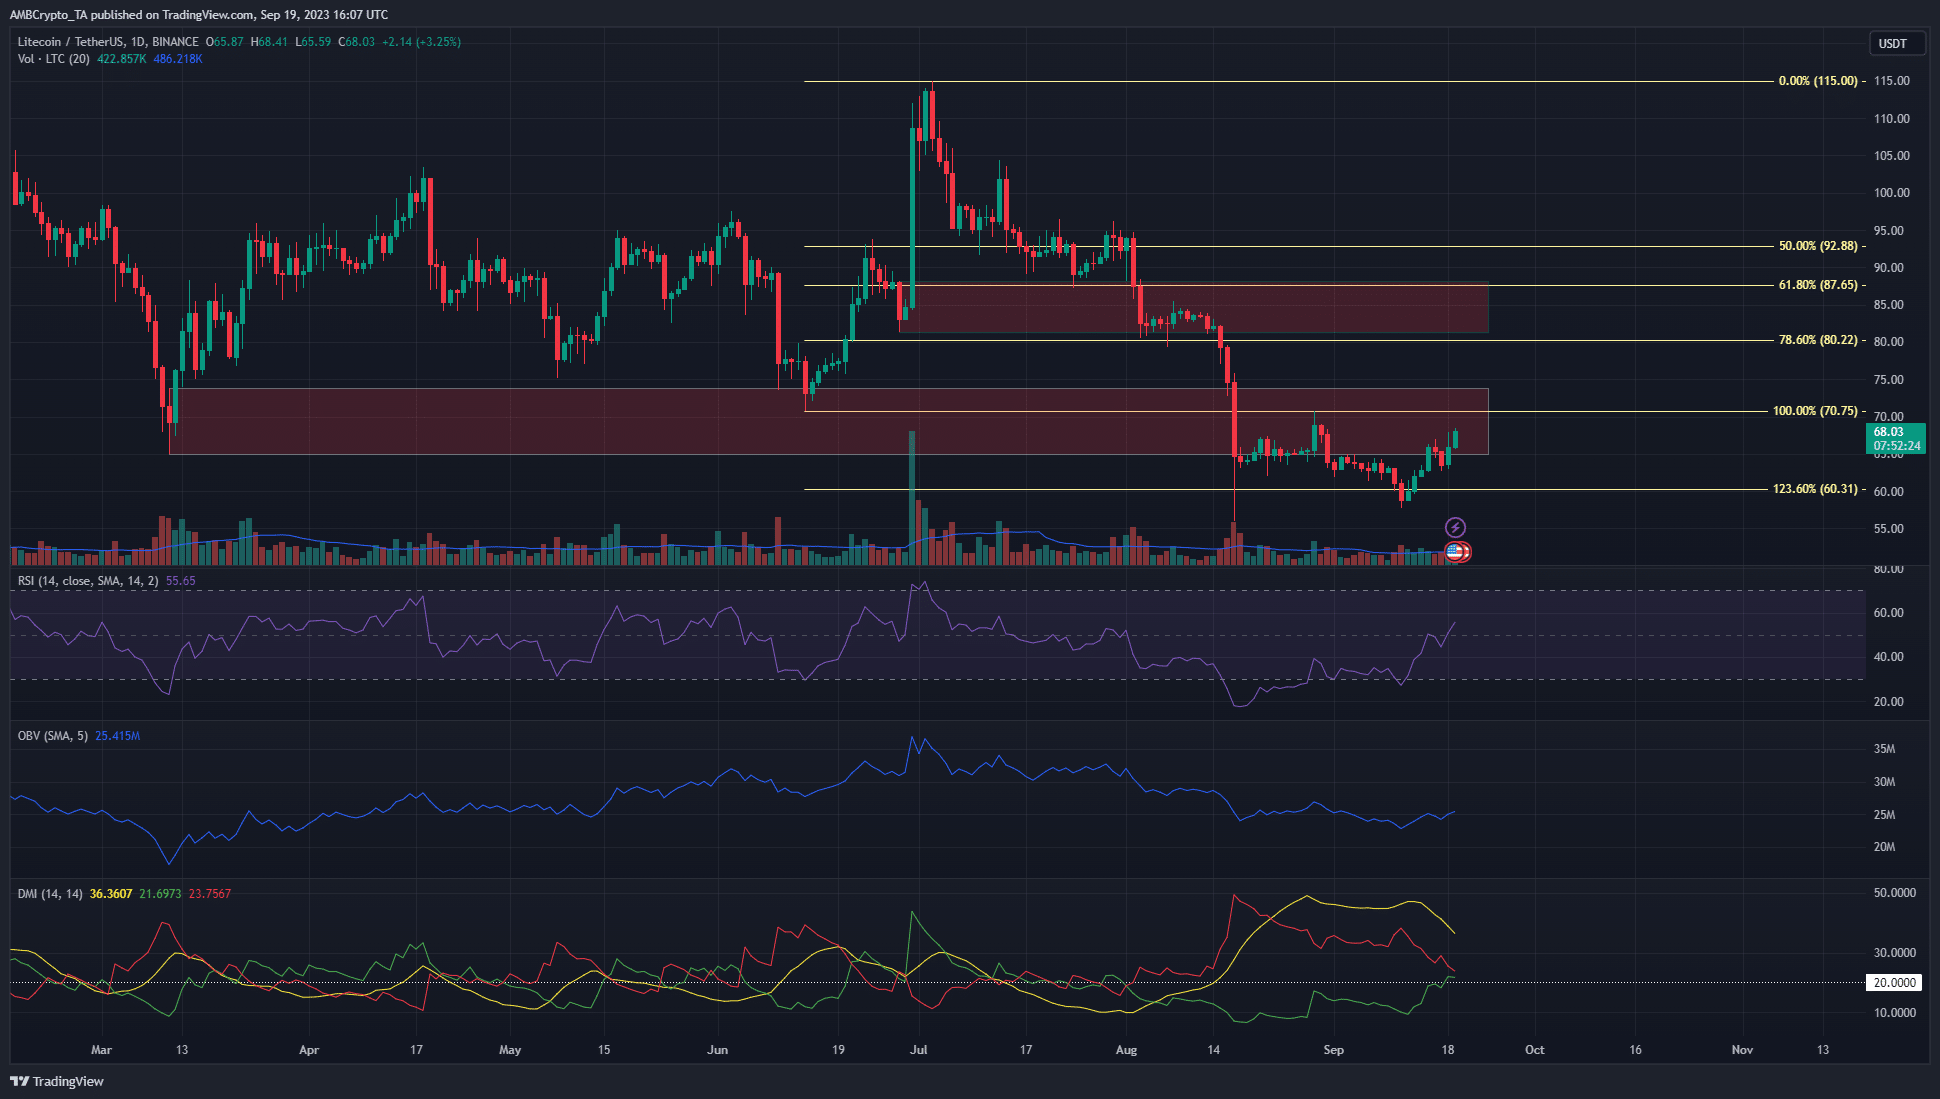
The two red boxes at $70 and 85 represent bearish breaker blocks on the 1-day timeframe. They were formerly seen as demand zones but the bears proved otherwise. On 29 August LTC retested the $70.75 as resistance and fell to the $60 mark.
At the time of writing, LTC was likely to repeat the same. Until LTC can close a daily trading session above $70.75, this can be the expectation for the coin. The On-Balance Volume (OBV) has been in decline to underline seller dominance.
The Directional Movement Index (DMI) showed a strong downtrend in progress, but the Relative Strength Index (RSI) was on the verge of breaking out past the neutral 50 mark. From a price action structure perspective, the $70.75 is the recent lower high. Hence a move above this zone would flip the structure bullishly.
The lack of activity from speculators is a concern for LTC bulls
The Fibonacci extension levels showed that another drop to the $60 mark was likely. Further south, the $43.4 level represented the 61.8% extension level. The lack of influx of capital reinforced the idea that LTC would plumb these lows.
How much are 1, 10, or 100 LTC worth today?
Since late August the Open Interest chart has been lackluster. Even when LTC bounced from $60 on 12 September the OI refused to budge higher, which showed market sentiment was not bullish.