LTC short-term ambitious traders looking for profits can target $49-$50 range

Disclaimer: The information presented does not constitute financial, investment, trading, or other types of advice and is solely the writer’s opinion.
Litecoin [LTC] surged to $66 last week but faced a brutal rejection above the range highs. At the time of writing, the price had slipped below the mid-range mark at $53.9 as well. In other news, Litecoin’s hash rate has actually benefited in recent days.
Ethereum [ETH]’s move to Proof of Stake (PoS) could have had a positive effect. On lower timeframes, this positive effect might not translate to price gains over the next day or two. Coinglass data showed that the Long vs Shorts ratio was slightly in favor of the shorts over the past 24 hours.
LTC- 4-Hour Chart
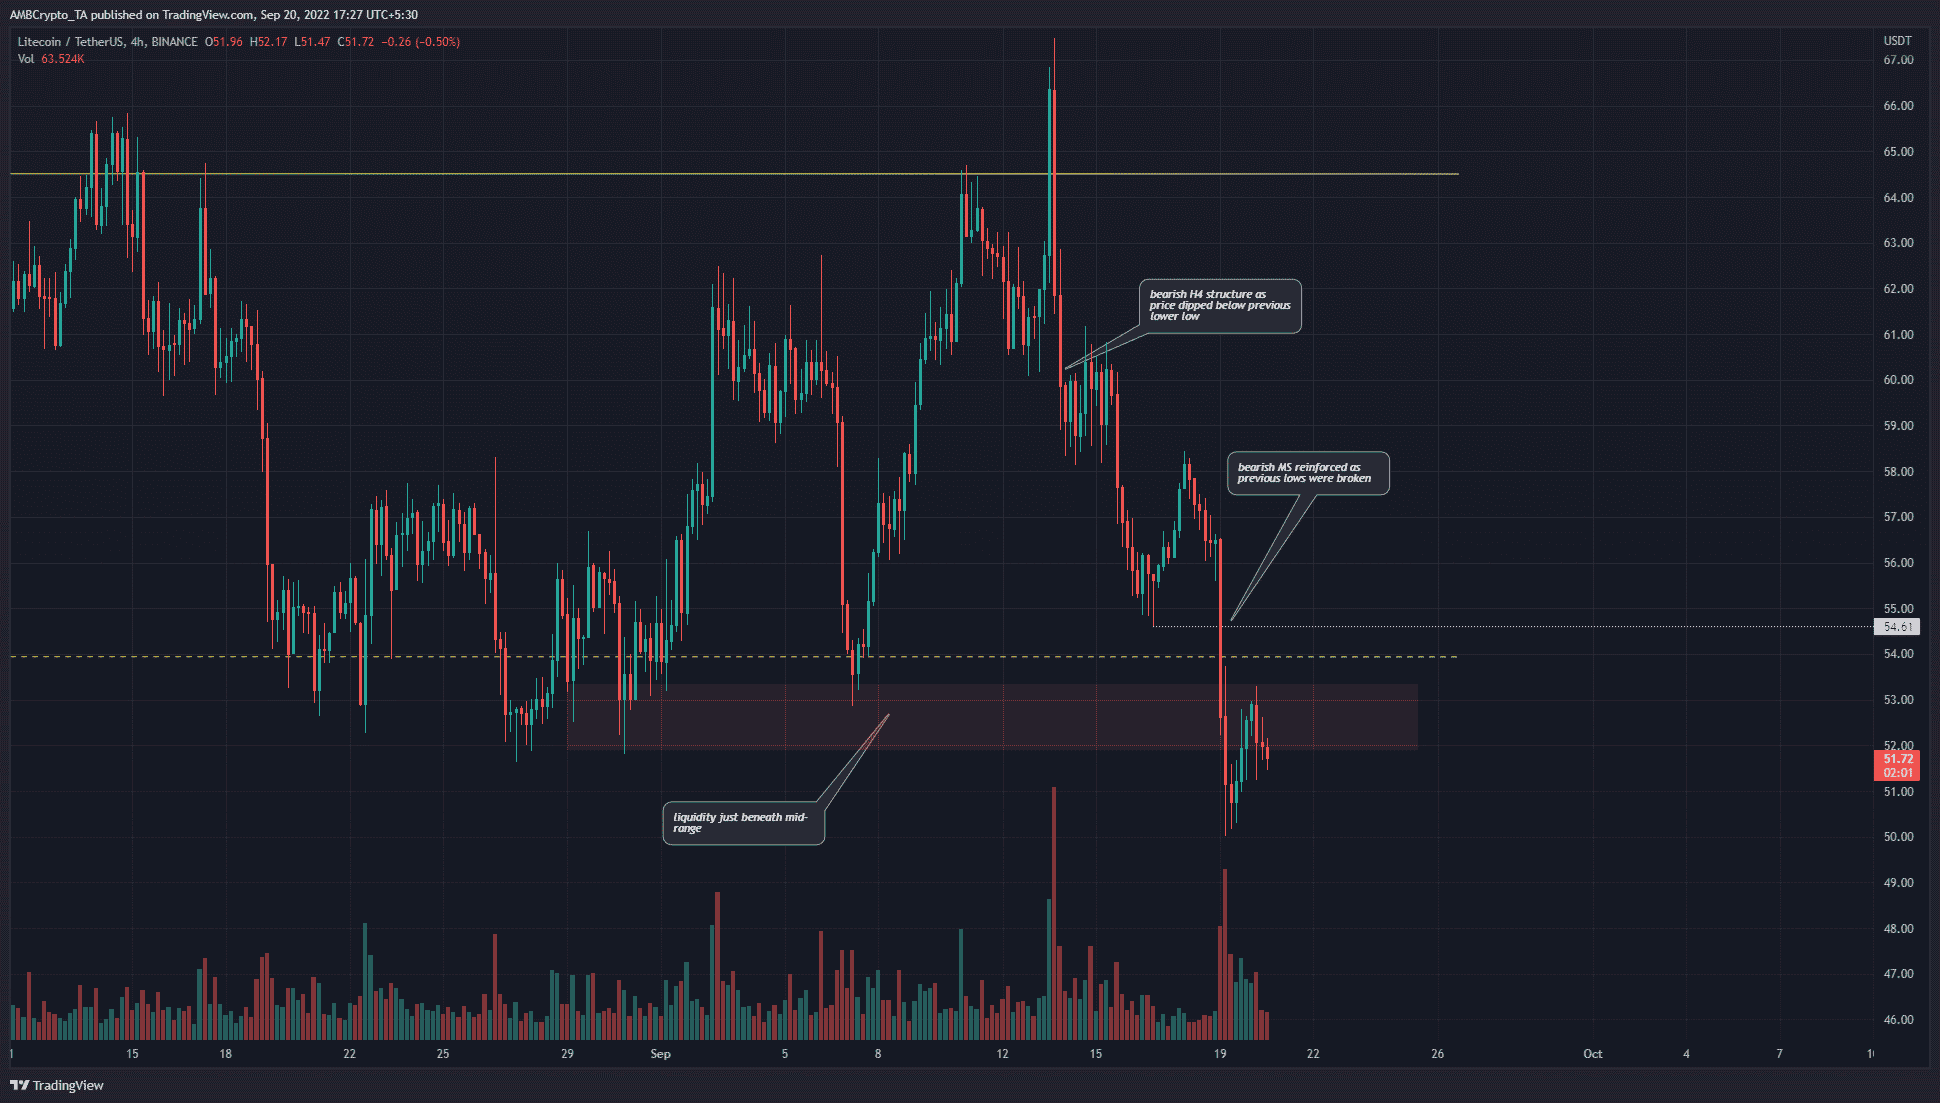
The short positions had strong technical evidence behind them. The price saw a rejection at the range (yellow) highs near $65. The mid-range (dashed yellow) was overwhelmed by selling pressure as well.
The $53-$52 zone witnessed multiple candlewicks reach toward it in late August and early September. This marked the zone as a significant pocket of liquidity where demand has been seen.
However, the past couple of days of trading have seen the sellers assume the driving position. Hence, the bias for the next few days would be bearish. This could change if LTC can reclaim the $53 zone as support.
LTC- 1-Hour Chart
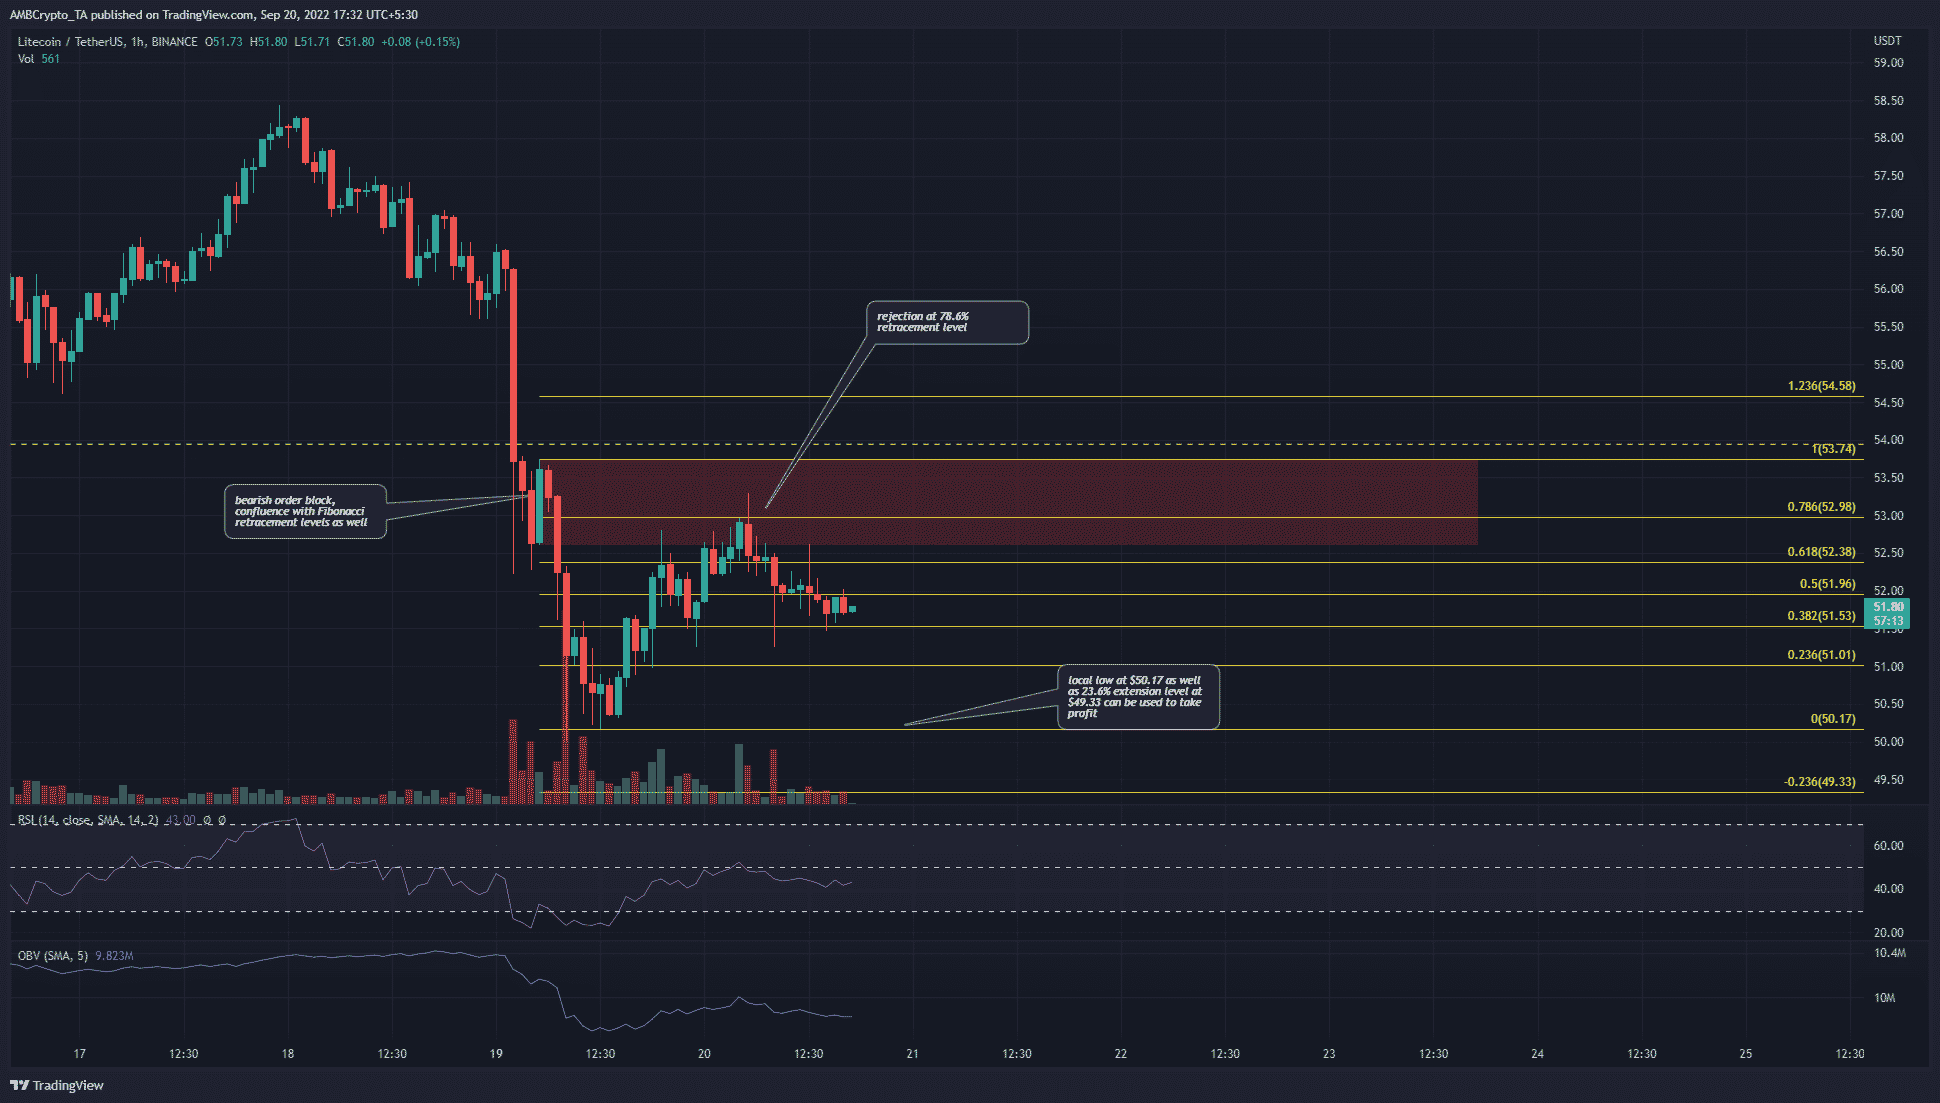
Zooming in to a lower timeframe, we can see a one-hour bullish engulfing candle. The hours after this candle formed saw the previous bearish market structure come into play, as a sharp plunge below $52.5 occurred. The price went on to dip as low as $50.17.
Therefore, the candle was marked as a bearish order block. Additionally a set of Fibonacci retracement levels (yellow) were drawn for this move down to $50.17. They showed the 78.6% retracement level to lie at $52.98.
This level acted as resistance as well, and LTC continued to dip after a retest of the order block. Short positions can look to take profit at the $50.17 lows, and ambitious traders can even target $49.33.
Conclusion
The formation of a bearish order block and the confluence it had with the Fibonacci retracement levels meant that another drop to $49 was likely. The entire move also occurred beneath the longer-term key level of support at the mid-range $54 mark. Accordingly, the bearish move could continue over the next day.


