
Disclaimer: The findings of the following analysis are the sole opinions of the writer and should not be considered investment advice
LUNA plunged from its all-time high at $119.55 on Binance, and it fell beneath the $84 area where the price saw a strong bullish impulse move in mid-March. However, the bulls would have some rope to hold on to as long as LUNA can stay above the $70.7.
It was unclear if the native token of Terra was in a retracement, or whether selling pressure is intense enough to force further downside. Bitcoin was just above the $40k mark, and if BTC drops below $39.2k, fear in the market could be intensified and force LUNA to register more losses.
LUNA- 12 Hour Chart
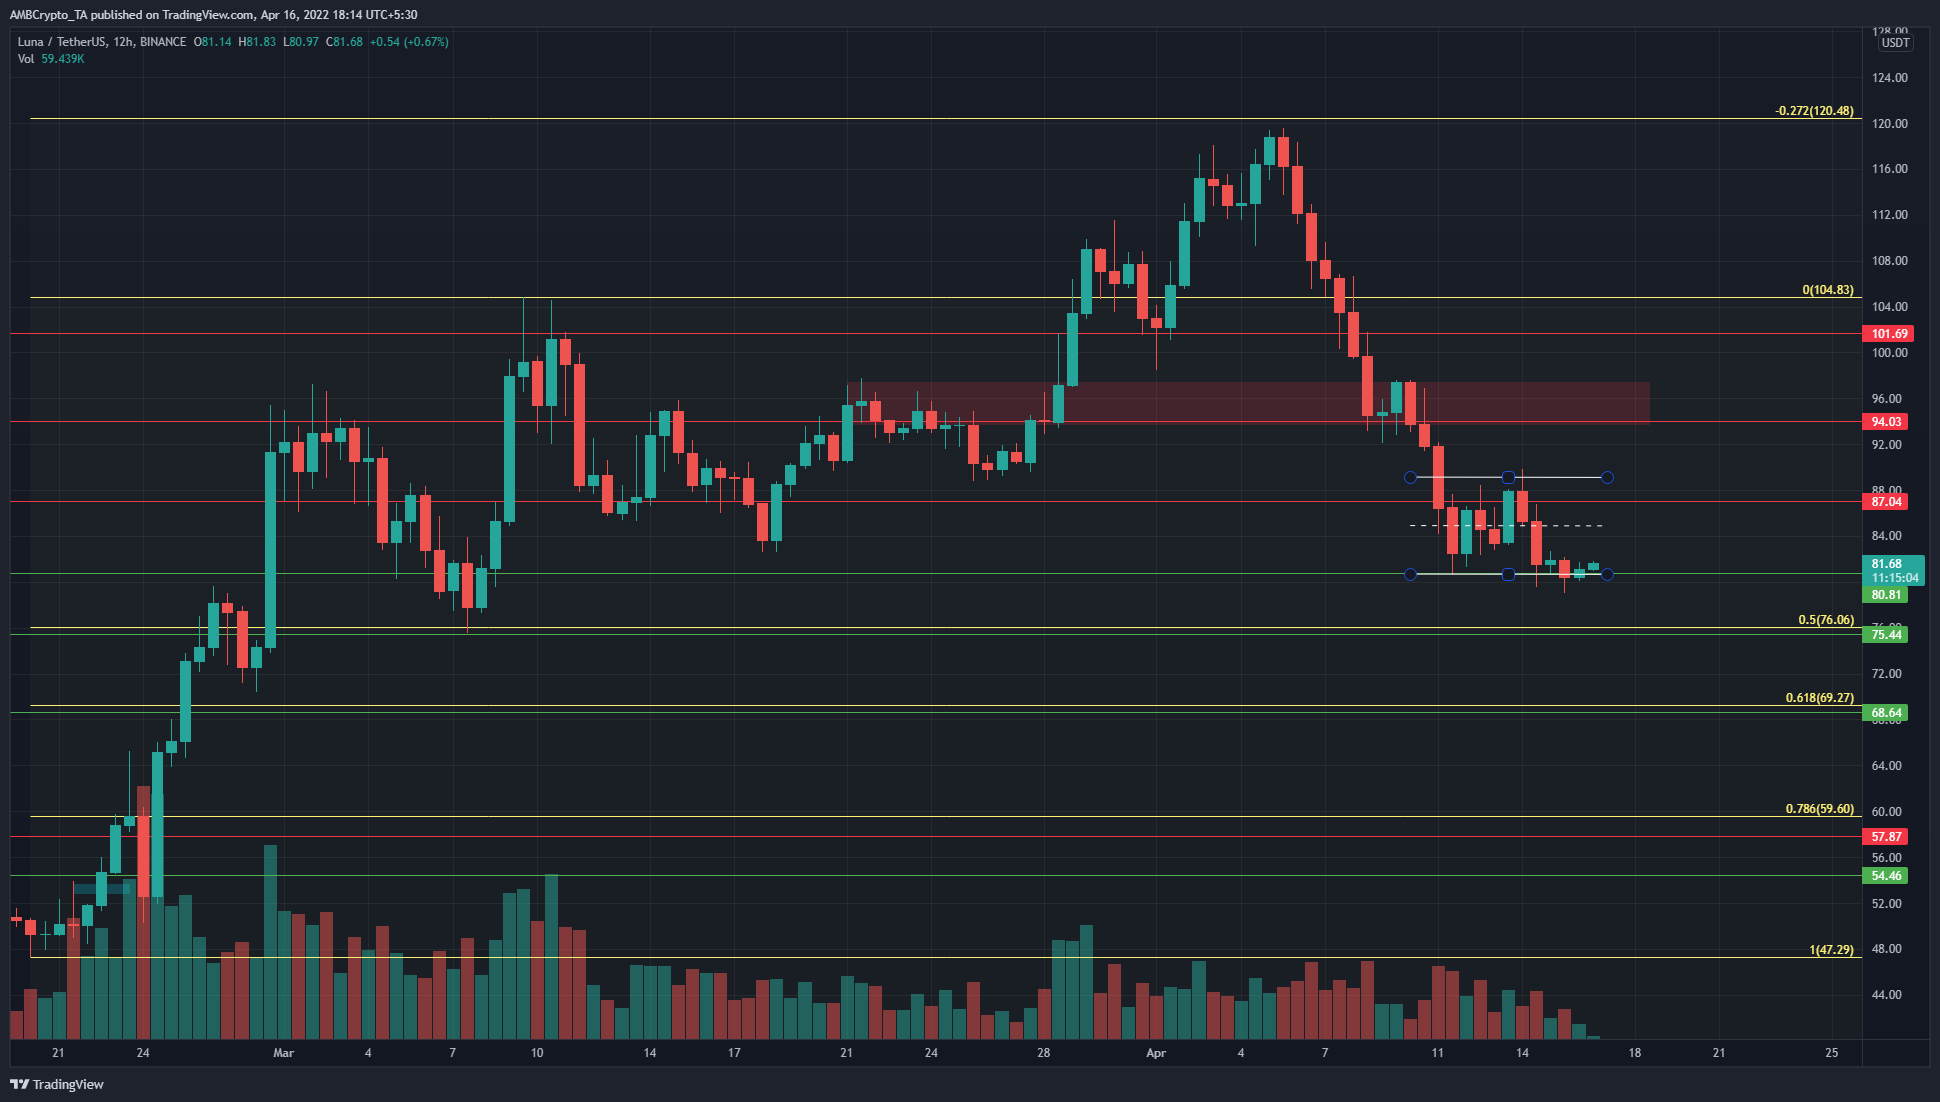
Source: LUNA/USDT on TradingView
In the past week, LUNA established a range (white) from $80.8-$89.2. However, it has retested the $87-$89 area as resistance in the past few days. This was a bearish development. It hinted that LUNA could retrace further south.
The Fibonacci retracement levels were plotted based on LUNA’s move from $47.29-$104.83 the previous month. It showed 50% and 61.8% retracement levels to lie at $76.06 and $69.27, which have some confluence with longer-term horizontal levels of significance.
The trading volume has been falling in the past few days, even as the price consolidated. This suggested that market participants were waiting for impetus in some direction before entering the fray.
Rationale

Source: LUNA/USDT on TradingView
Both the RSI and the Awesome Oscillator showed strong bearish momentum. The RSI on the 12-hour chart has been unable to climb past the 40 mark, while the Awesome Oscillator also slipped beneath the zero line.
The DMI also showed a strong downward trend in progress over the past week, as both the ADX and the -DI (yellow and red respectively) were above the 20 mark.
These developments have taken place in response to LUNA’s sharp plunge from $116. The OBV has also seen a pullback. Yet, this move south could be just that- a pullback. The OBV continued to remain in an uptrend on a higher timeframe.
Conclusion
Was LUNA pulling back toward the $70 mark in search of demand? Was this bearish move more than just a mere retracement? When in doubt, zoom out, the saying goes. As long as $70.6 holds, the bullish bias has some credence. Bitcoin could influence the direction of Terra’s token as well.