LUNA – To ATH or not to ATH; here’s what’s next for the in-demand alt

Disclaimer: The findings of this analysis are the sole opinions of the writer and should not be considered investment advice
The past few hours have seen Bitcoin and many altcoins make strong gains, with LUNA being one of the strongest performers. Bitcoin’s move above $39k has sparked life into the bulls in the near term once more. Tether’s dominance in the market has been dropping over the same period, with the same underlining sidelined capital being deployed.
Does this signal a longer-term trend change for the market? Maybe not. However, times are certainly strongly bullish for Terra.
LUNA- 1 hour chart
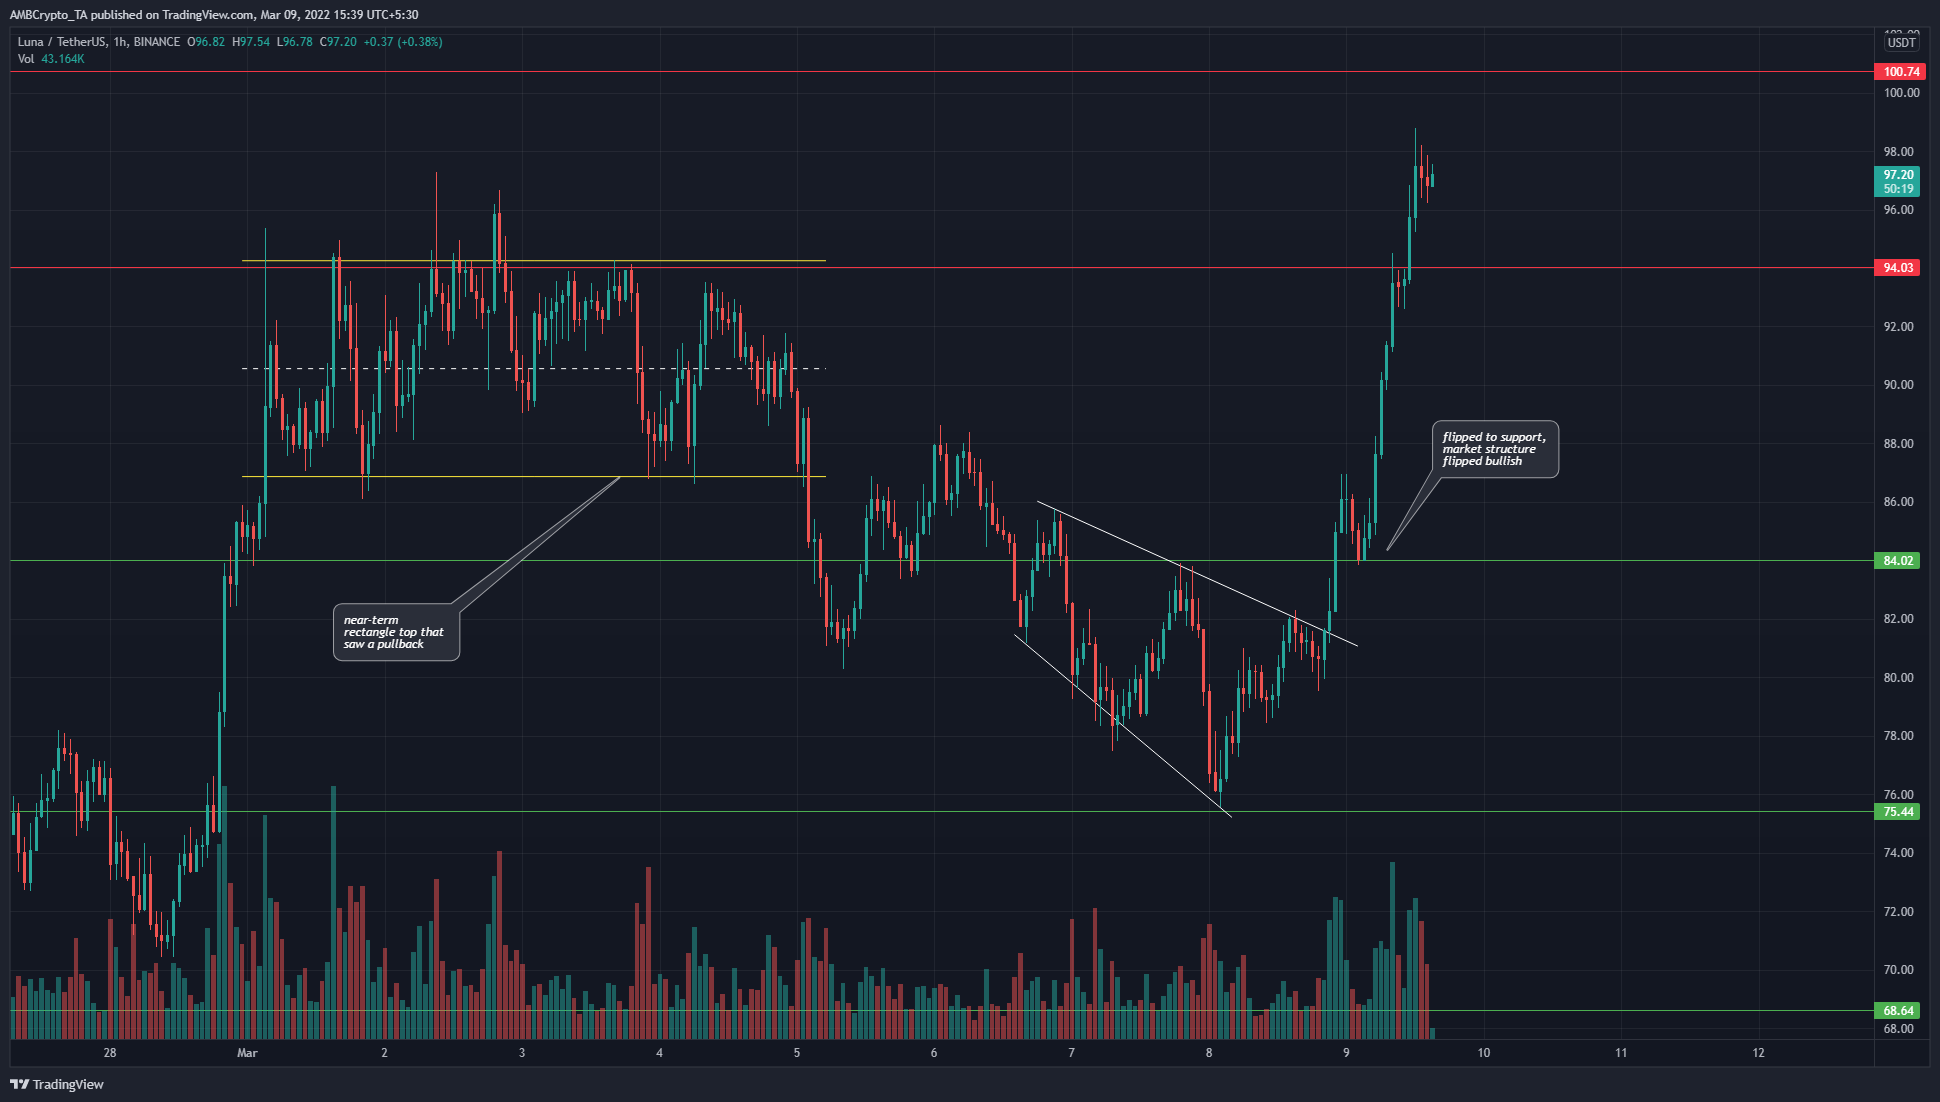
In early March, LUNA formed a range after an unrelenting upwards run from $52 to $93 the previous week. This range was broken in a few days, highlighting that it was a short-term rectangle top pattern. This saw LUNA retrace to the $76 support area.
Over the past few days, the price has formed a falling broadening wedge pattern (white). It has also broken out of it in the last 24 days. This breakout has been explosive and on the back of strong demand.
The $84-level was flipped to support, and at the time of writing, LUNA was trading above the $94-level as well. The gains in recent hours could have left uncollected liquidity to the downside. And, a revisit to the $88-$90 region cannot be ruled out either.
Rationale
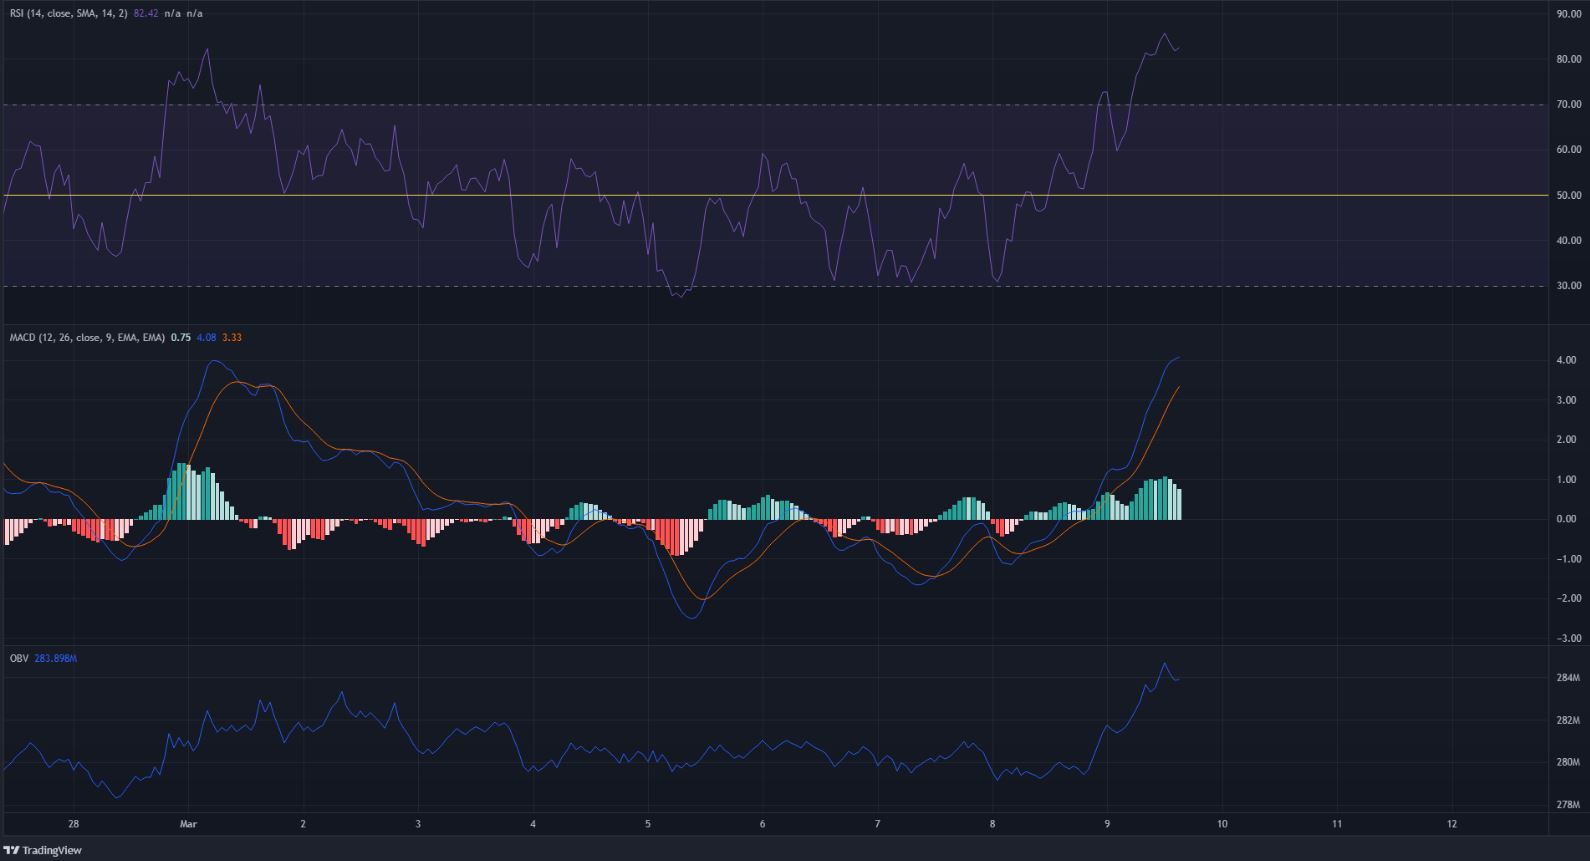
The indicators flashed strong bullish momentum following its recent gains. The RSI was in overbought territory on the hourly chart while the MACD was also well above the zero line. An overbought RSI by itself does not indicate a pullback is coming.
The most interesting indicator was the OBV as the end of the downtrend on the price charts was seen quite plainly on the same with a spike north. This suggested that the rally from $76 was on the back of heavy buying pressure.
Conclusion
The next few hours could see LUNA break above $100 and $103. On the other hand, a short-term buyer of this asset would be looking for a bearish divergence and a pullback towards $88-$92.
A revisit to this area would be a buying opportunity. Beyond the ATH, LUNA could target $110 in the days to come, based on Fibonacci extension levels not shown here.