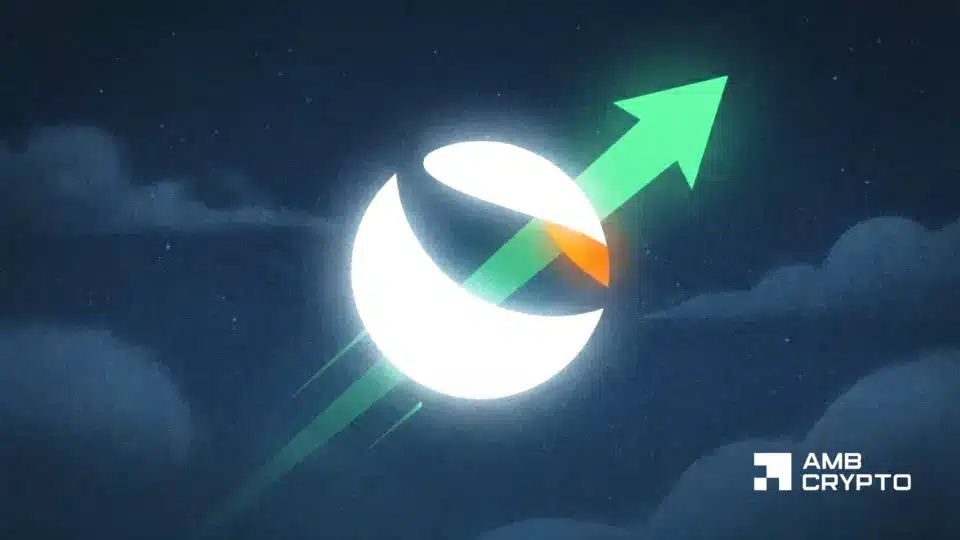
LUNC’s bullish shift confirmed: Can buyers sustain an uptrend?
LUNC has shown upward momentum since the early February market crash.
Terra Classic [LUNC] saw a burn of 877.5 million tokens over the past week. In this time, the altcoin has rallied 48.2%, and some social media posts were linking the two as cause and effect.
The correlation was less solid upon closer examination. Since the 13th of May, 2022, the total LUNC burn has amounted to 444.63 billion. This averages to 307 million LUNC burnt a day, more than twice the previous seven days’ average.
Additionally, the total supply is 5.51 trillion LUNC, making the past week’s burn just a drop in the bucket. It does not explain a 48% move.
What, then, drove LUNC’s rally?
In short, a surfeit of aggressive buyers was behind the move. It is tough to zero in on their specific reasons, but Terra Luna has had bullish momentum since late February.

The daily chart above shows how the token did not set new swing lows during the market crash on the 6th of February. LUNC has made higher lows since then, following the rest of the crypto market.
This momentum eventually resulted in the breakout past the $0.000045 resistance zone, which has held sway throughout 2026, and was an important result. Even more defining was the recent daily session close above $0.00007246.
This was a pivotal development because it flipped the 1-day structure from bearish to bullish. Therefore, long-term holders and investors can now assume a bullish outlook and treat pullbacks as buying opportunities.

The monthly session also closed above a local high, making the 1-day timeframe’s structural shift all the more dominant. It remains to be seen if the bulls can keep the momentum going.
Traders’ call to action – Wait for a pullback

The 4-hour chart showed the price making higher highs while both the Awesome Oscillator and the A/D indicator made lower highs. This meant LUNC was likely overextended.
The Fibonacci retracement levels (pale yellow) showed that traders can use a drop to the $0.0000644-$0.0000672 golden pocket to buy the altcoin ahead of a bullish continuation.
A drop below the $0.0000608 swing low would invalidate this idea and point toward a deeper pullback in May.
Final Summary
- Terra Classic has rallied nearly 50% in a week and was up 5% in the past 24 hours.
- The higher timeframes aligned to illuminate a bullish structure shift, and traders can find a buying opportunity in the coming days.


