Maker [MKR] threatens a push lower, can $750 stave off bears’ efforts

Disclaimer: The information presented does not constitute financial, investment, trading, or other types of advice and is solely the writer’s opinion.
MakerDAO’s token MKR formed a series of lower highs on the price charts in recent days. This was indicative of a downtrend in progress, and the technical indicators also agreed. However, the price also sat atop a level of support.
Bitcoin also traded just above a region of support at the time of writing. Can the bulls win the staring contest or will the bears impose their will on the market yet again?
MKR- 4-Hour Chart
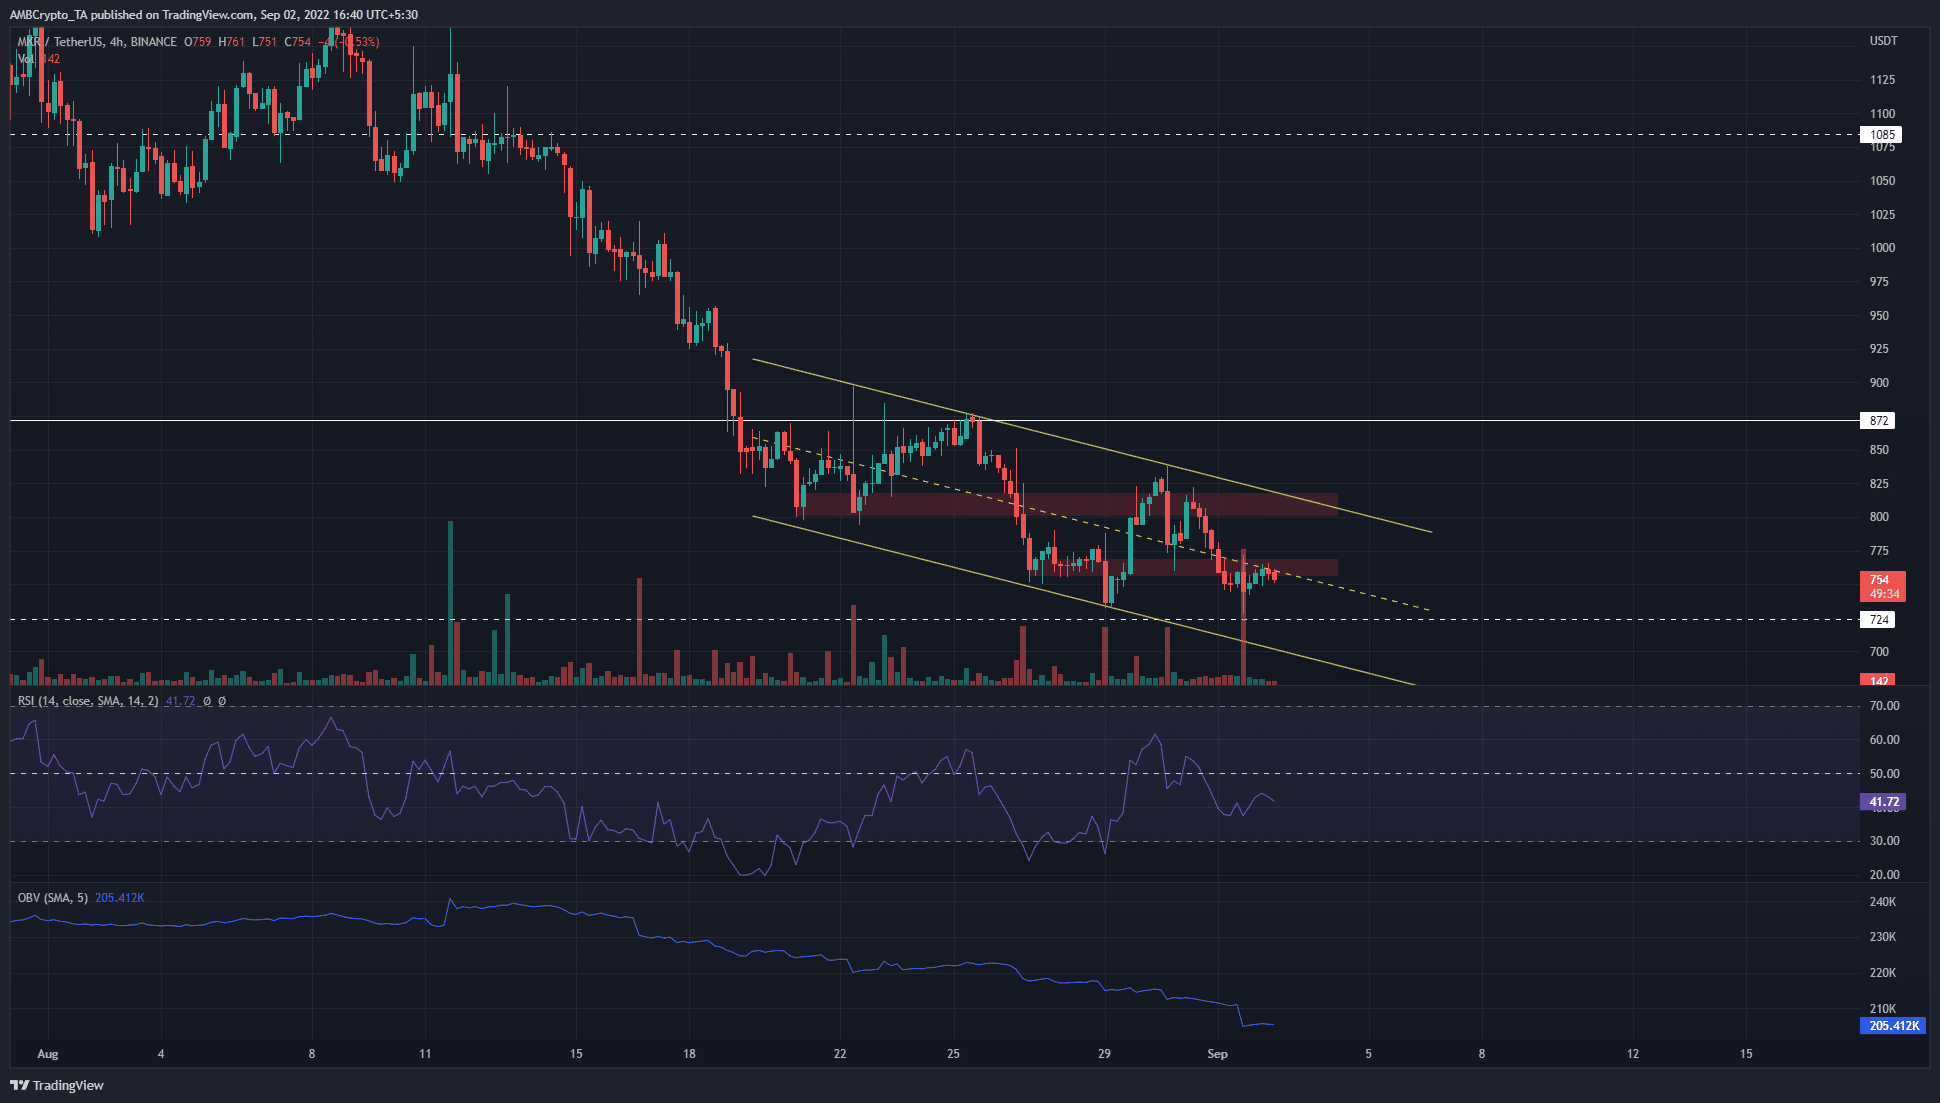
The four-hour chart showed MKR to trade within a descending channel (yellow) over the past two weeks. The $800 region and the $760 region were marked in red to be significant short-term regions. The past few days of trading saw both of these zones tested as a zone of supply.
To the south, the $724 level was a place where MKR could see a minor bounce. However, there was a lot of volatility in this region in June. Hence, the $700-$720 area can be expected to act as a demand zone once more.
The Relative Strength Index (RSI) dipped to 41 to show mounting bearish momentum. The On-Balance Volume (OBV) has been in a pronounced downtrend, and clearly highlighted the lack of buying pressure.
MKR- 1-Hour Chart
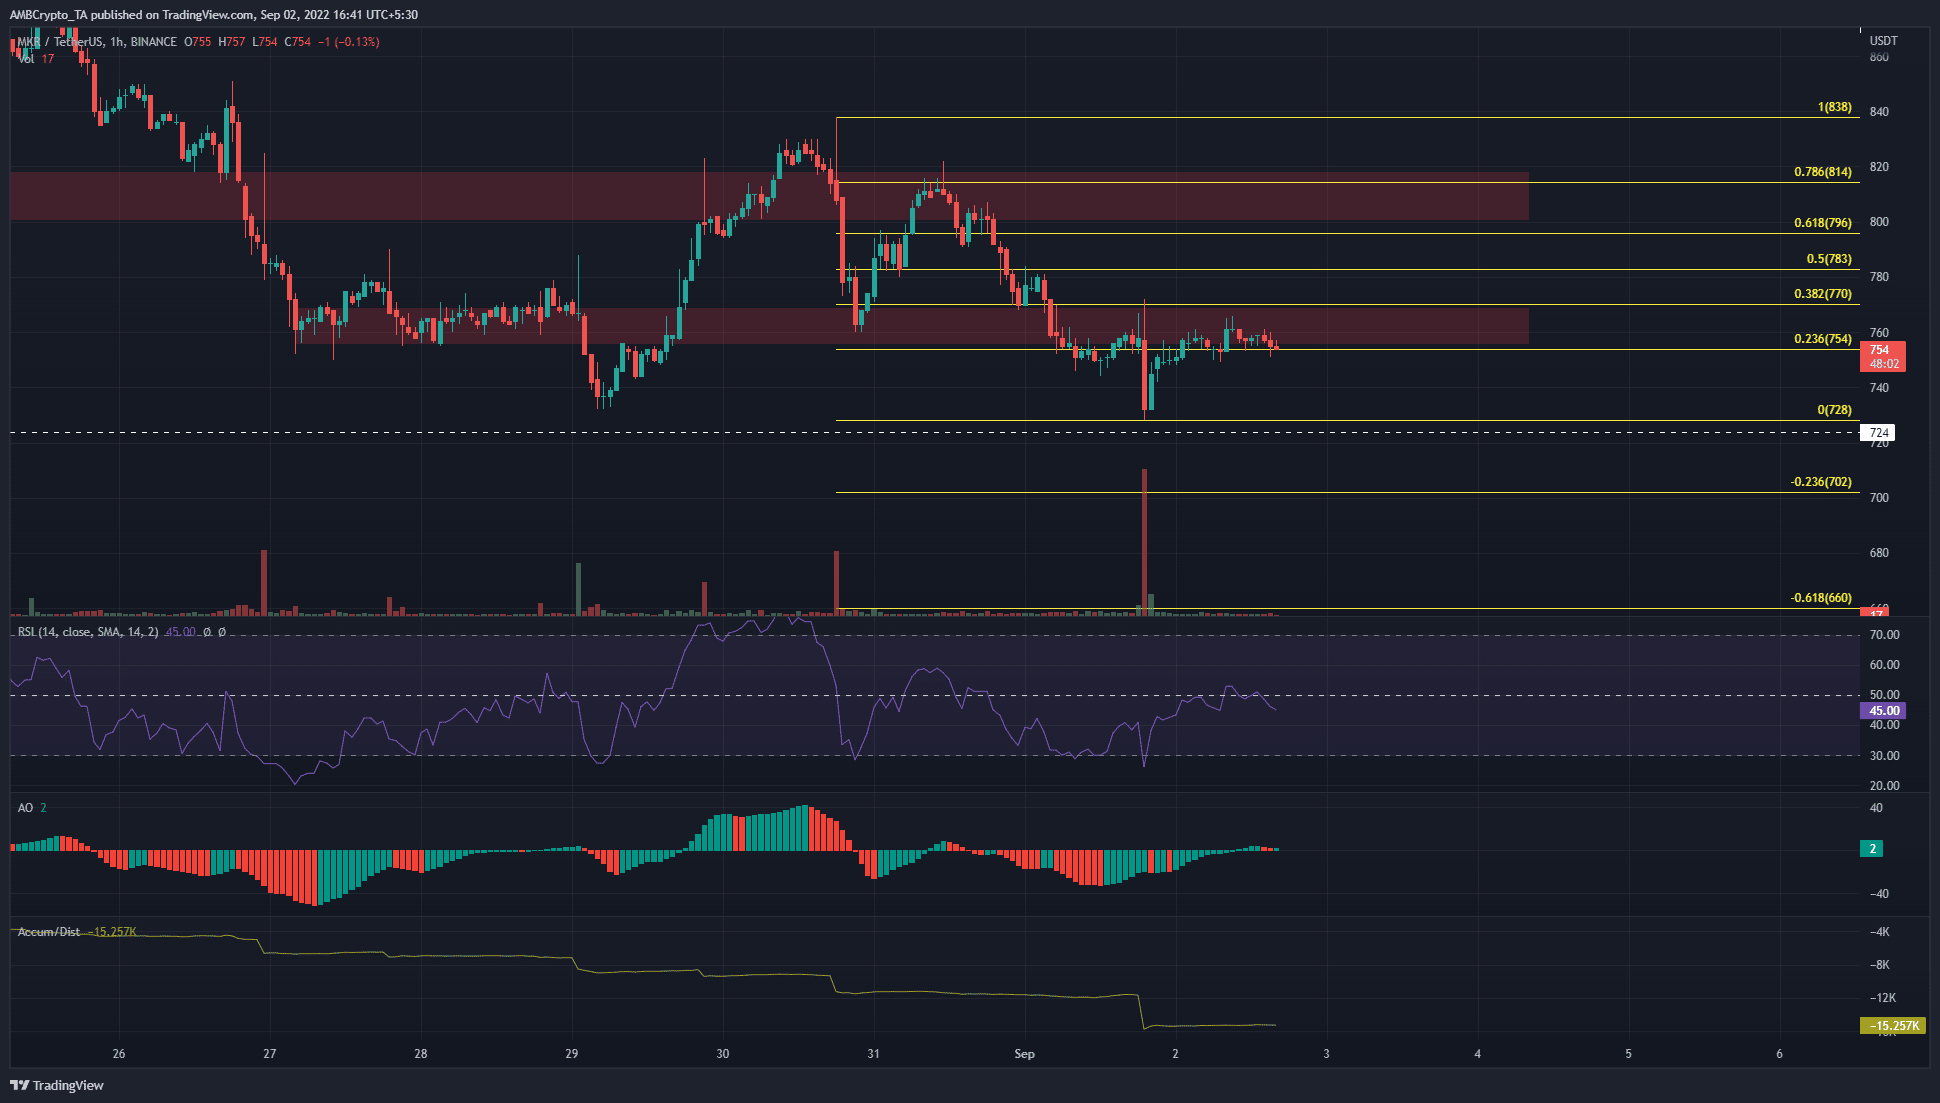
A set of Fibonacci retracement levels (yellow) were plotted based on MKR’s drop from $838 to $728. The 78.6% retracement level lay at $814 and has acted as resistance. Many of the other retracement levels have also been respected by the price action.
At the time of writing, the $770 mark served as strong resistance, and the bulls were fighting to maintain MKR above the $754 level.
The A/D indicator, like the OBV, has been in a strong downtrend in the H1 timeframe. The Awesome Oscillator (AO) and the RSI were closer to neutral as they snaked around the zero line and the neutral 50 level respectively.
Conclusion
The four-hour timeframe suggested a strong move downward was likely brewing for MKR. If Bitcoin fails to hold on to the $19.6k support, it could likely send MKR plunging. There was some support above the $700 level but buyers could be overwhelmed by a tsunami of selling.
The lack of buying on the OBV was particularly telling. Coupled with the Fibonacci extension levels, it appeared likely that a move below $750 could result in MKR pushing as far south as $660.


