MANA: A breakout over this resistance region could bode well

Disclaimer: The findings of the following analysis are the sole opinions of the writer and should not be considered investment advice
Decentraland is the largest metaverse coin by market capitalization, standing at $4.49 billion at press time. It has registered gains amounting to nearly 8% in the past week alone. Even though the coin has been trending lower on the charts since December, the $2.28 area of demand has stood strong. Another rally from those same lows appeared to have been initiated, and $2.54 was the level to beat for the bulls.
MANA- 1H
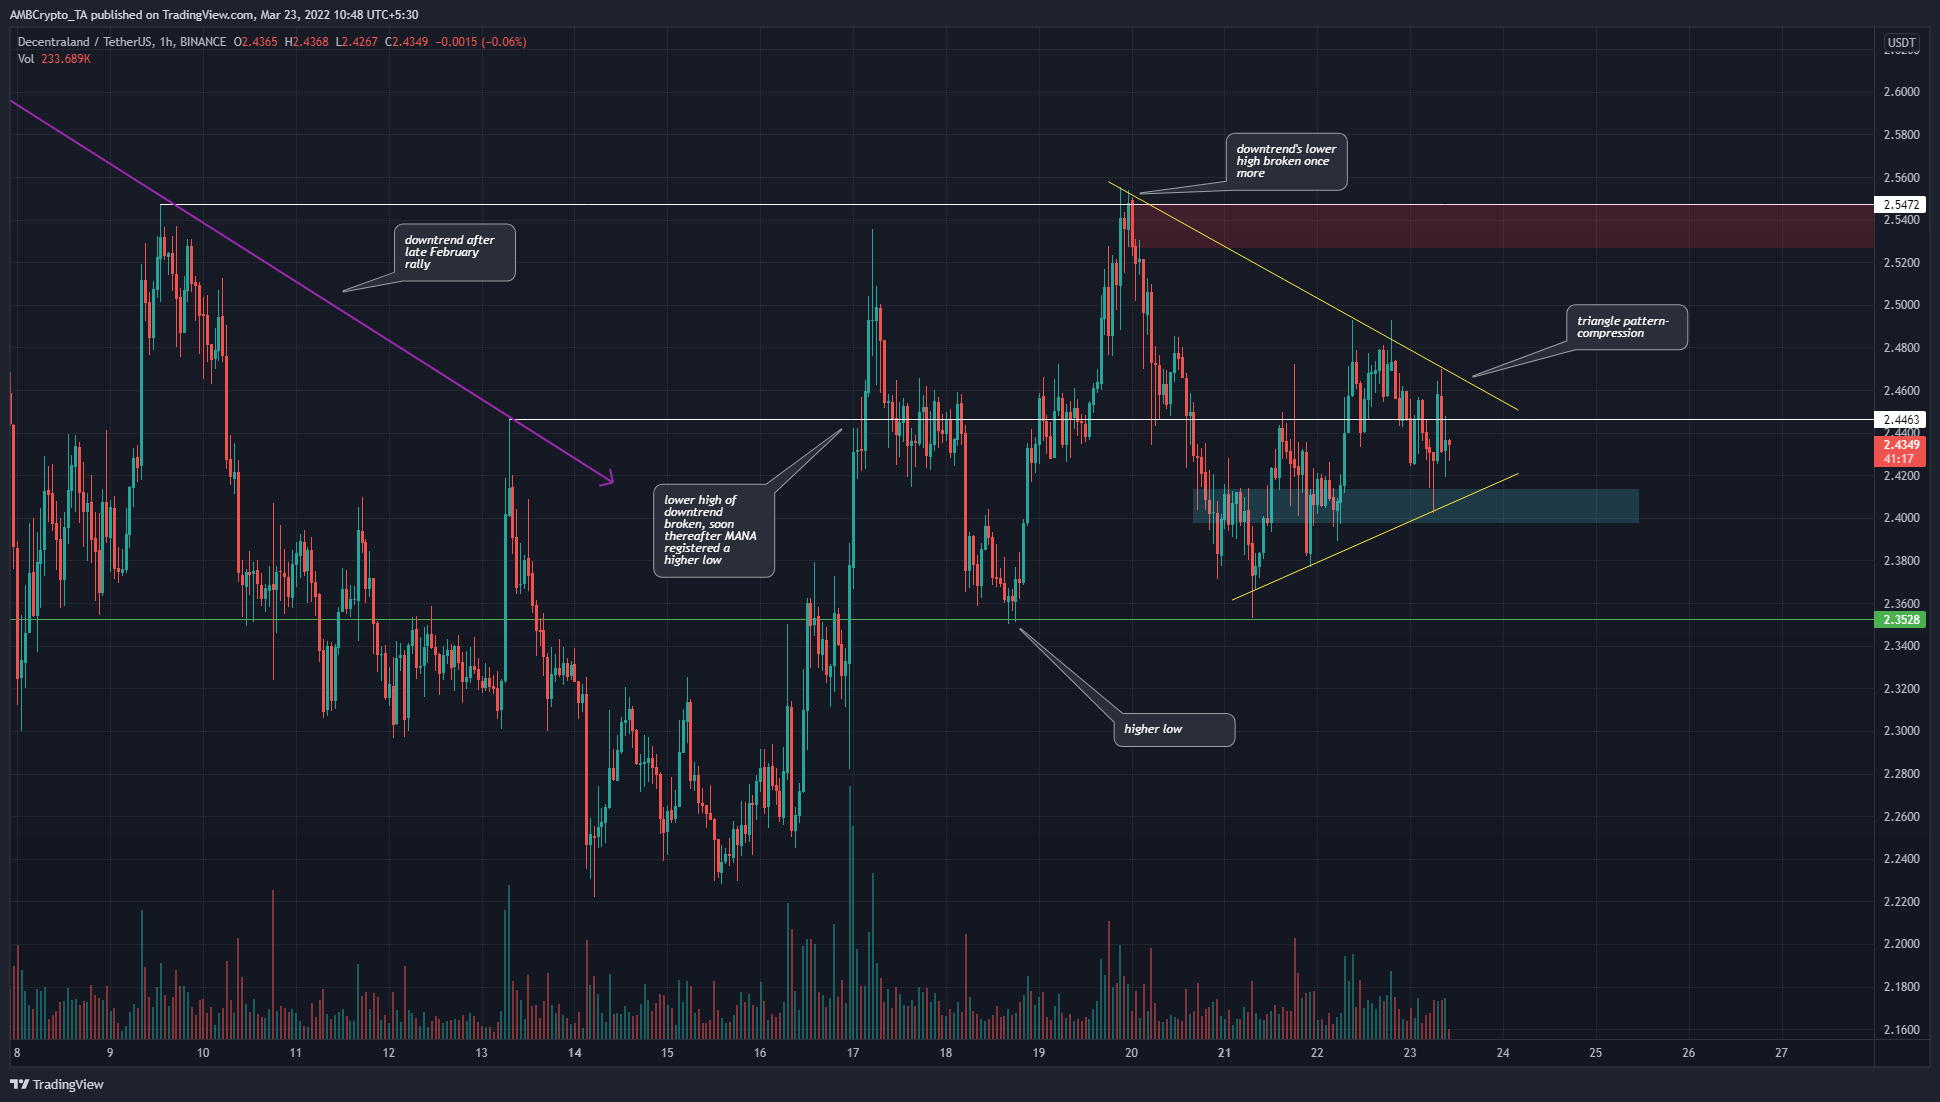
MANA rallied from $2.28 lows to $2.84 in late February but has been losing value since then as it registered a series of lower highs. However, that appeared to change in the past week. A strong wave of buying broke the short-term bearish market structure by driving the prices past the $2.44 level (white).
The $2.44 level also has a longer-term significance, as it acted as support in November and January.
Moreover, in the past week, the buyers seem to have established an uptrend, as the price registered a series of higher lows after $2.44 was beaten. At press time, the $2.54 and $2.66 further north are likely to serve as supply zones.
In the past few days, the price has also formed a symmetrical triangle pattern (yellow) and could see a move to the upside. $2.4 (cyan box) could be tested in search of demand.
Rationale
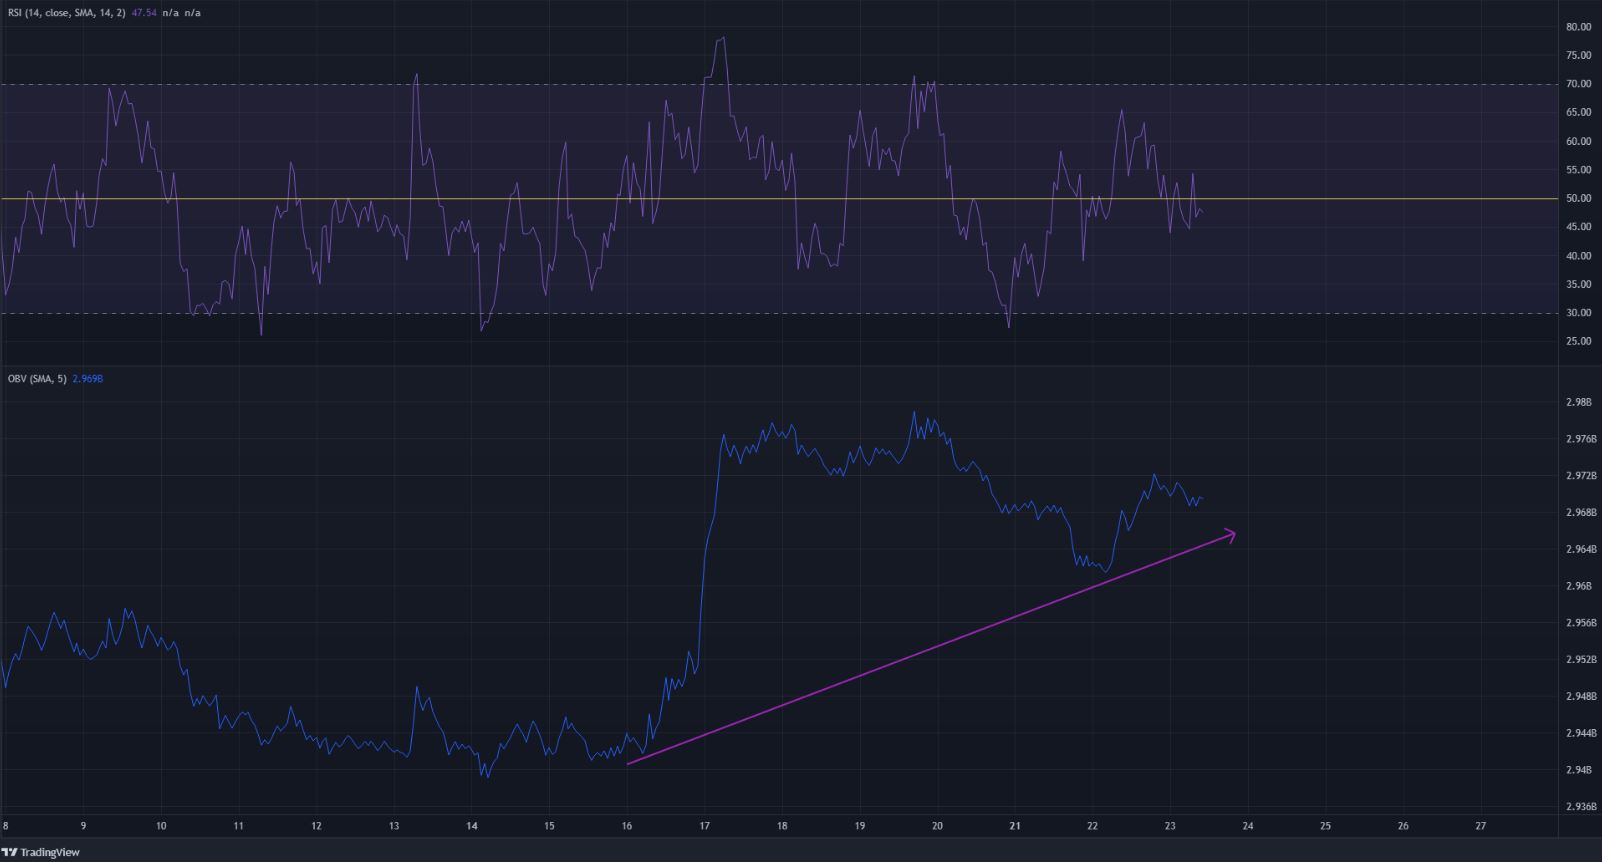
The RSI on the hourly stood at 47.54 and has been somewhat neutral in the past 24 hours, as the price bounced between $2.4-$2.46. The RSI alone did not reveal too much about MANA’s impending move.
On the other hand, the OBV showed a clear spike and a sustained uptrend in the past week following the large spike in buying volume that initiated the upside move. If the price can break above $2.54, the OBV is expected to set a new high as well. Failure to do so would suggest that demand was weakening behind the price rally.
Conclusion
The indicators showed that, inside the triangle pattern, momentum has shifted multiple times from the bullish to the bearish camp, but some steady demand was witnessed. A move above the triangle pattern could see MANA break past the $2.54 resistance zone.


