MANA rises 15% in a month, but is a correction looming?
MANA sees an uptick in new demand in the past few weeks. However, key indicators suggest that the altcoin has become overbought.

- MANA’s network activity has climbed to its highest level since June.
- Volatility markers assessed on a daily chart hint at the possibility of a price retracement.
Amid the general market bullishness, the new demand for metaverse-based token Decentraland [MANA] has risen to its highest in the last month, data from Santiment showed.
Is your portfolio green? Check out the MANA Profit Calculator
According to the on-chain data provider, on 24 October, the daily count of new addresses created to trade MANA totaled 414. This represented a 76% uptick from the 235 new addresses recorded the previous day.
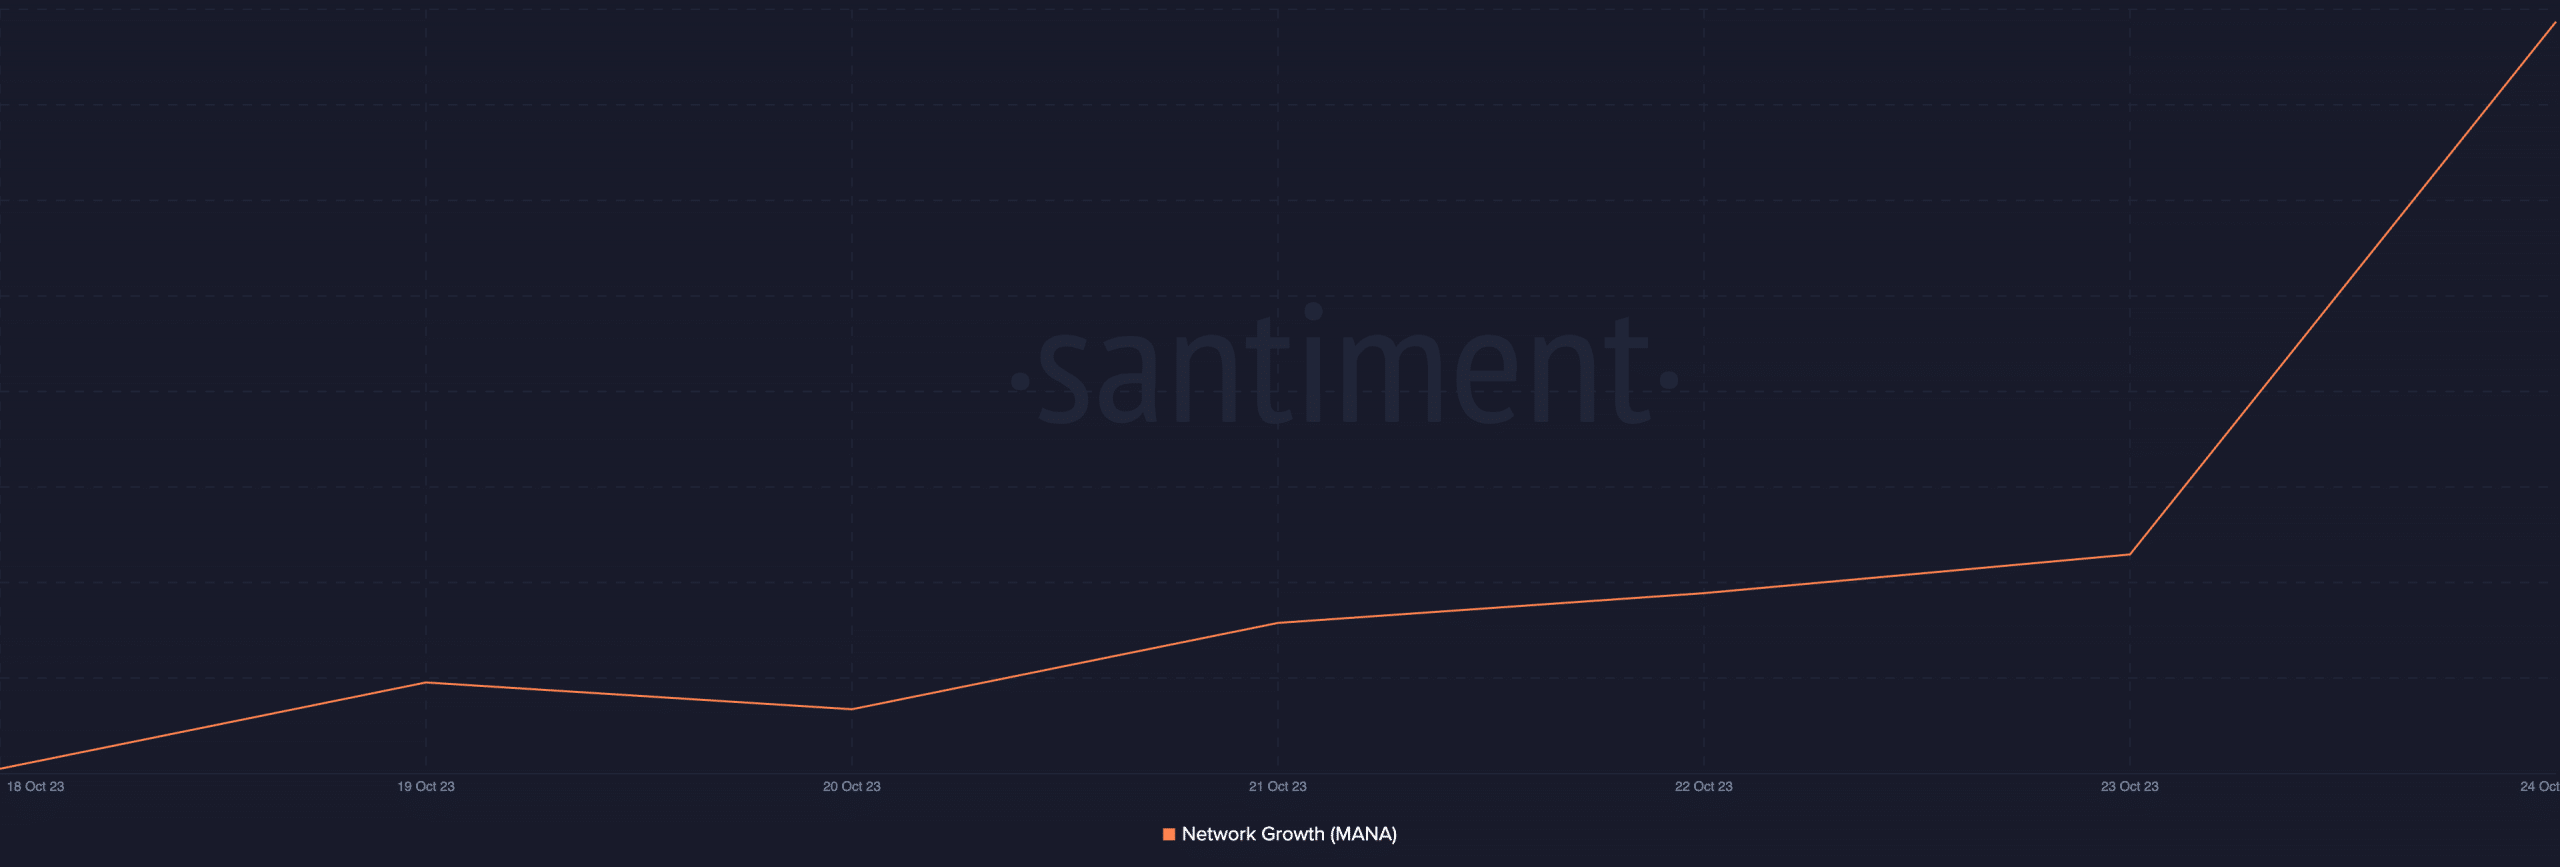
When the daily count of the new addresses created to trade a crypto asset surges in this manner, it indicates a growth in network activity, which often results in a positive price action.
In addition to a growth in MANA’s daily new addresses, the count of active addresses involved in MANA transactions on a daily basis has also climbed to a multi-month high.
As of 24 October, the total number of addresses involved in MANA transactions totaled 1269, its highest since June, data from Santiment showed.

MANA prints green, but there is a catch
At press time, MANA exchanged hands at $0.35. The last time the token traded at this high was on 14 August. In the last month, its value has increased by over 15%, according to data from CoinMarketCap.
The increased trading activity witnessed in the past few weeks has pushed MANA to overbought highs; readings observed from the token’s price action on a daily chart showed.
At the time of writing, MANA’s Relative Strength Index was 74.16. Likewise, its Money Flow Index (MFI) was 93.32.
The values spotted on these indicators suggested that MANA’s accumulation might have reached an exhaustion point – this is often followed by a downward price correction as buyers find it challenging to support any further price rally at these levels.
Hence, a downward retracement might be on the horizon.
Further, an assessment of a few volatility markers suggested that the market was marked by severe price fluctuations, making the possibility of a downward price movement even more likely.
For example, MANA’s Average True Range (ATR) has trended upward since 22 October. This indicator measures market volatility by calculating the average range between high and low prices over a specified number of periods.
Read Decentraland’s [MANA] Price Prediction 2023-2024
At 0.014 at press time, the ATR showed that MANA’s recent price growth makes it prone to price swings in the coming days.
Also, the tokens growing Bollinger Bandwidth (BBW) confirmed the presence of volatility in the MANA market. As of this writing, this indicator returned a value of 0.33, positioned in an uptrend.