
Disclaimer: The information presented does not constitute financial, investment, trading, or other types of advice and is solely the writer’s opinion.
- The lower timeframe market structure of MANA was bullish.
- The $0.75 level acted as support- but will it be broken soon in a pullback?
Decentraland has performed strongly in the market over the past month. Its token MANA continued to have a bullish bias on the price charts. However, there was evidence on higher timeframe charts that the upward momentum has begun to wane.
How much are 1, 10, 100 MANA worth
A move back below $0.75 could flip the bias. Bitcoin also hovered near the $23.4k area and faced stiff opposition near $24.2k, and beneath the $25k mark.
The rally of the past month could continue but a move above $25k would ease the fears of overextension from the bulls.
The daily timeframe developed a divergence and a pullback could be imminent
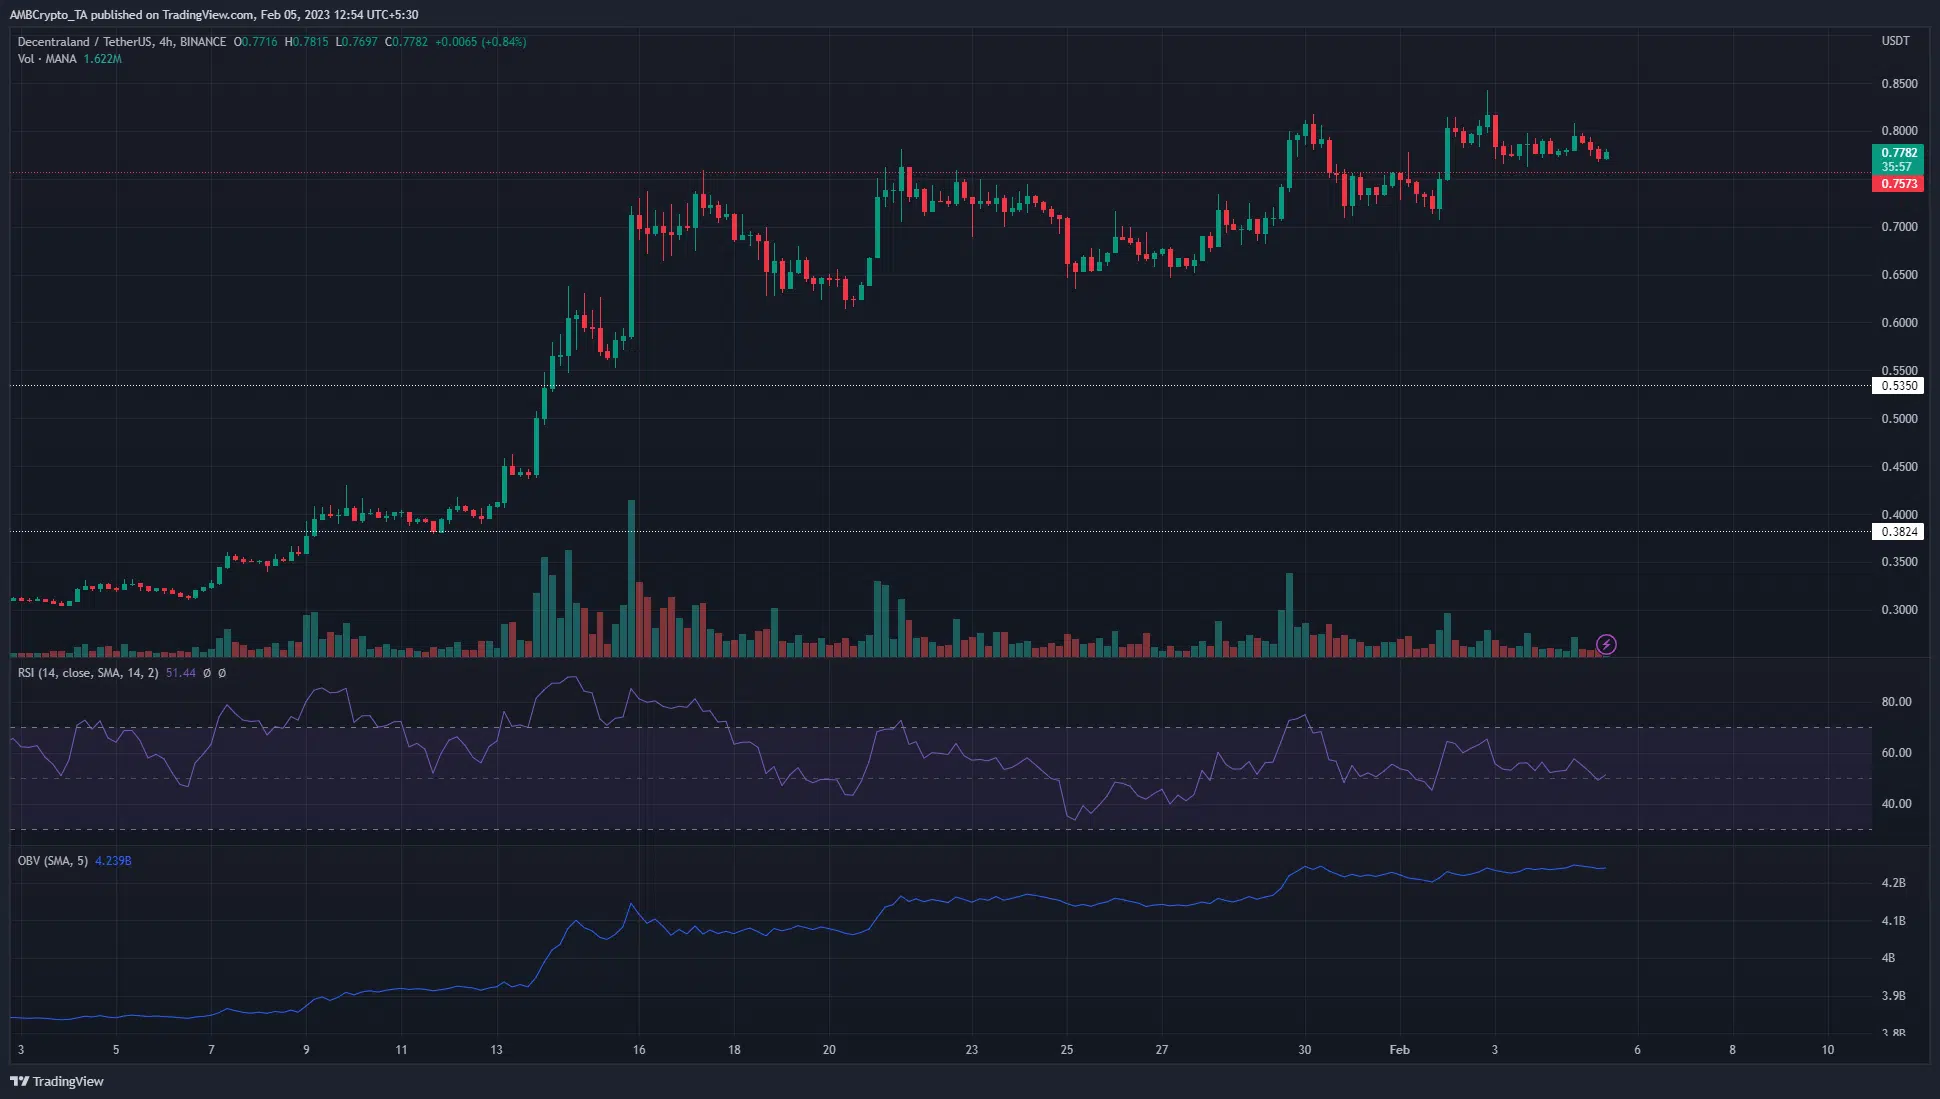
Source: MANA/USDT on TradingView
The $0.75 level has acted as resistance since mid-January. Previously in early September, this area had served as support before being flipped to resistance later that month. Therefore, the developments of the past few days were bullish, as $0.75 has been flipped to support once more.
Realistic or not, here’s MANA’s market cap in BTC’s terms
On lower timeframes like H1 and H4, it was apparent that $0.81 was an area of interest for the bears. A session close above it could galvanize the buyers.
However, as already mentioned, Bitcoin faced intense resistance in the $24.5k-$25k area. Its move above $23k wasn’t swift, which sparked doubts about the demand behind the asset.
Monday’s high and low could establish a range for MANA as well and is one to watch out for. The RSI was at 51 to show neutral momentum. The OBV crept upward over the past few days, which suggested that there was a demand for the token.
Open Interest remains flat- participants are sidelined and sentiment remains neutral
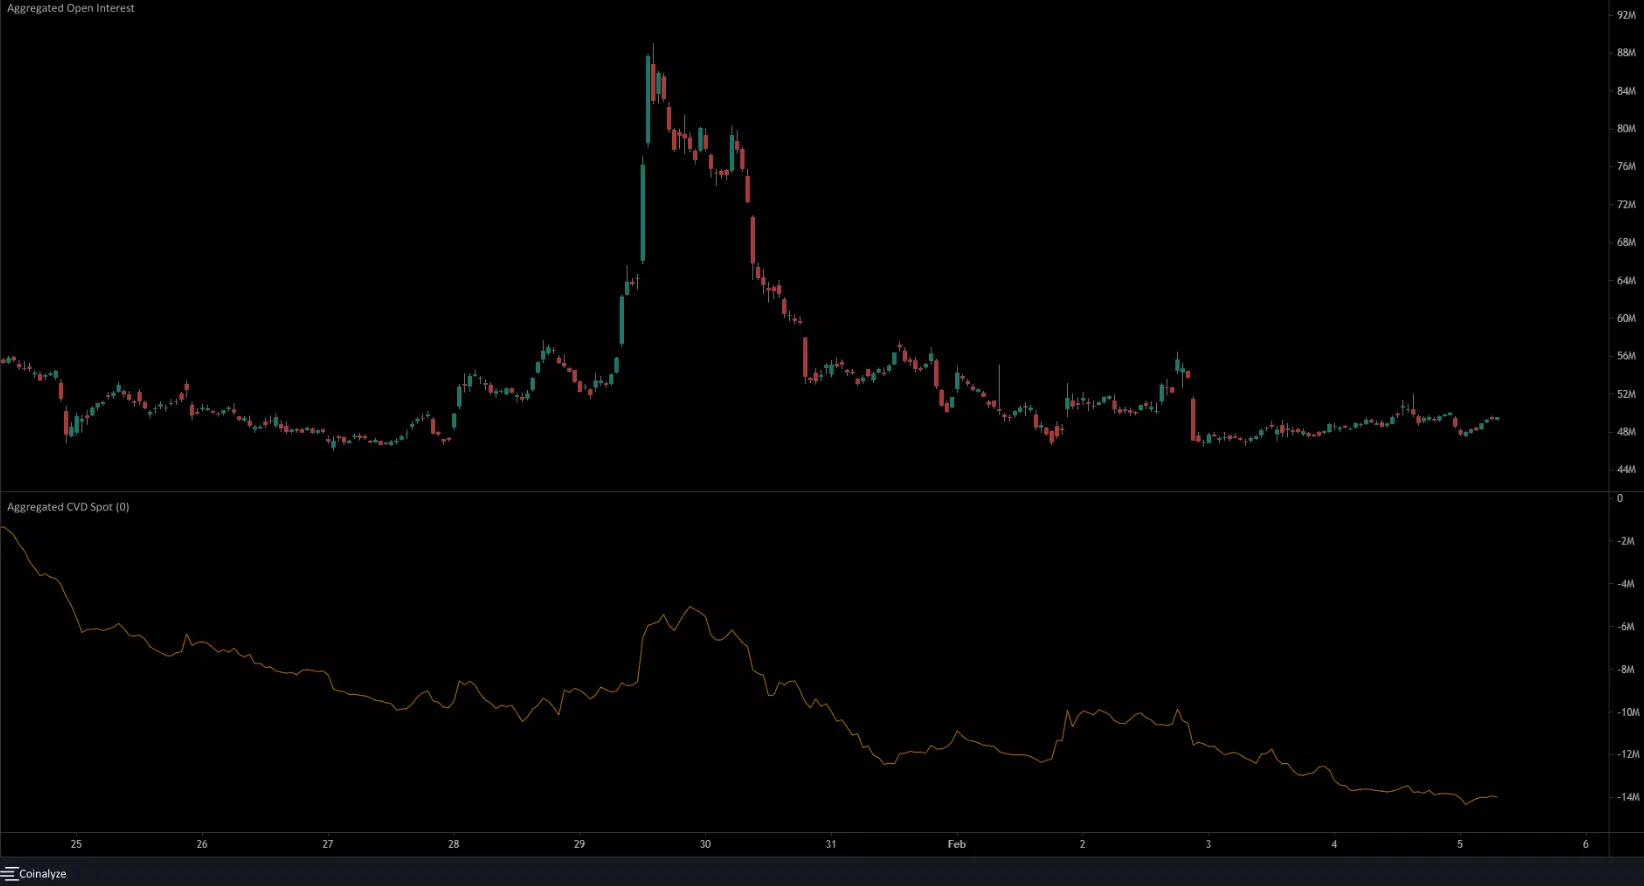
Source: Coinalyze
The spot CVD has been in a downtrend over the past three days, which clashed with the findings from the OBV. This indicated that sellers had the upper hand.
Even though MANA flipped $0.75 to support, buying pressure has not stepped in. Whether this changes over the coming week remains to be seen. A breakout for Bitcoin above $25k could usher in the next leg upward for MANA.
The price and the OI have been flat in recent days. Since February 1, the price has faced resistance at $0.81. Meanwhile, the OI has made a lower high, which suggested discouraged long positions and a lack of participation. A surge in OI could occur alongside a breakout past $0.81.