MANA: Will the resistance be a tough nut to crack despite its bullish structure

Disclaimer: The findings of the following analysis are the sole opinions of the writer and should not be considered investment advice
Amazon India tweeted a teaser about a partnership with Decentraland a couple of days ago, which might also involve phone maker OnePlus, although the tweet was mum on any further details. On the charts, MANA had a bullish tinge to it on the daily timeframe. There was a critical zone of resistance to the north that the bulls would have to plow through- however, is there sufficient demand to drive such a move?
MANA- 1D
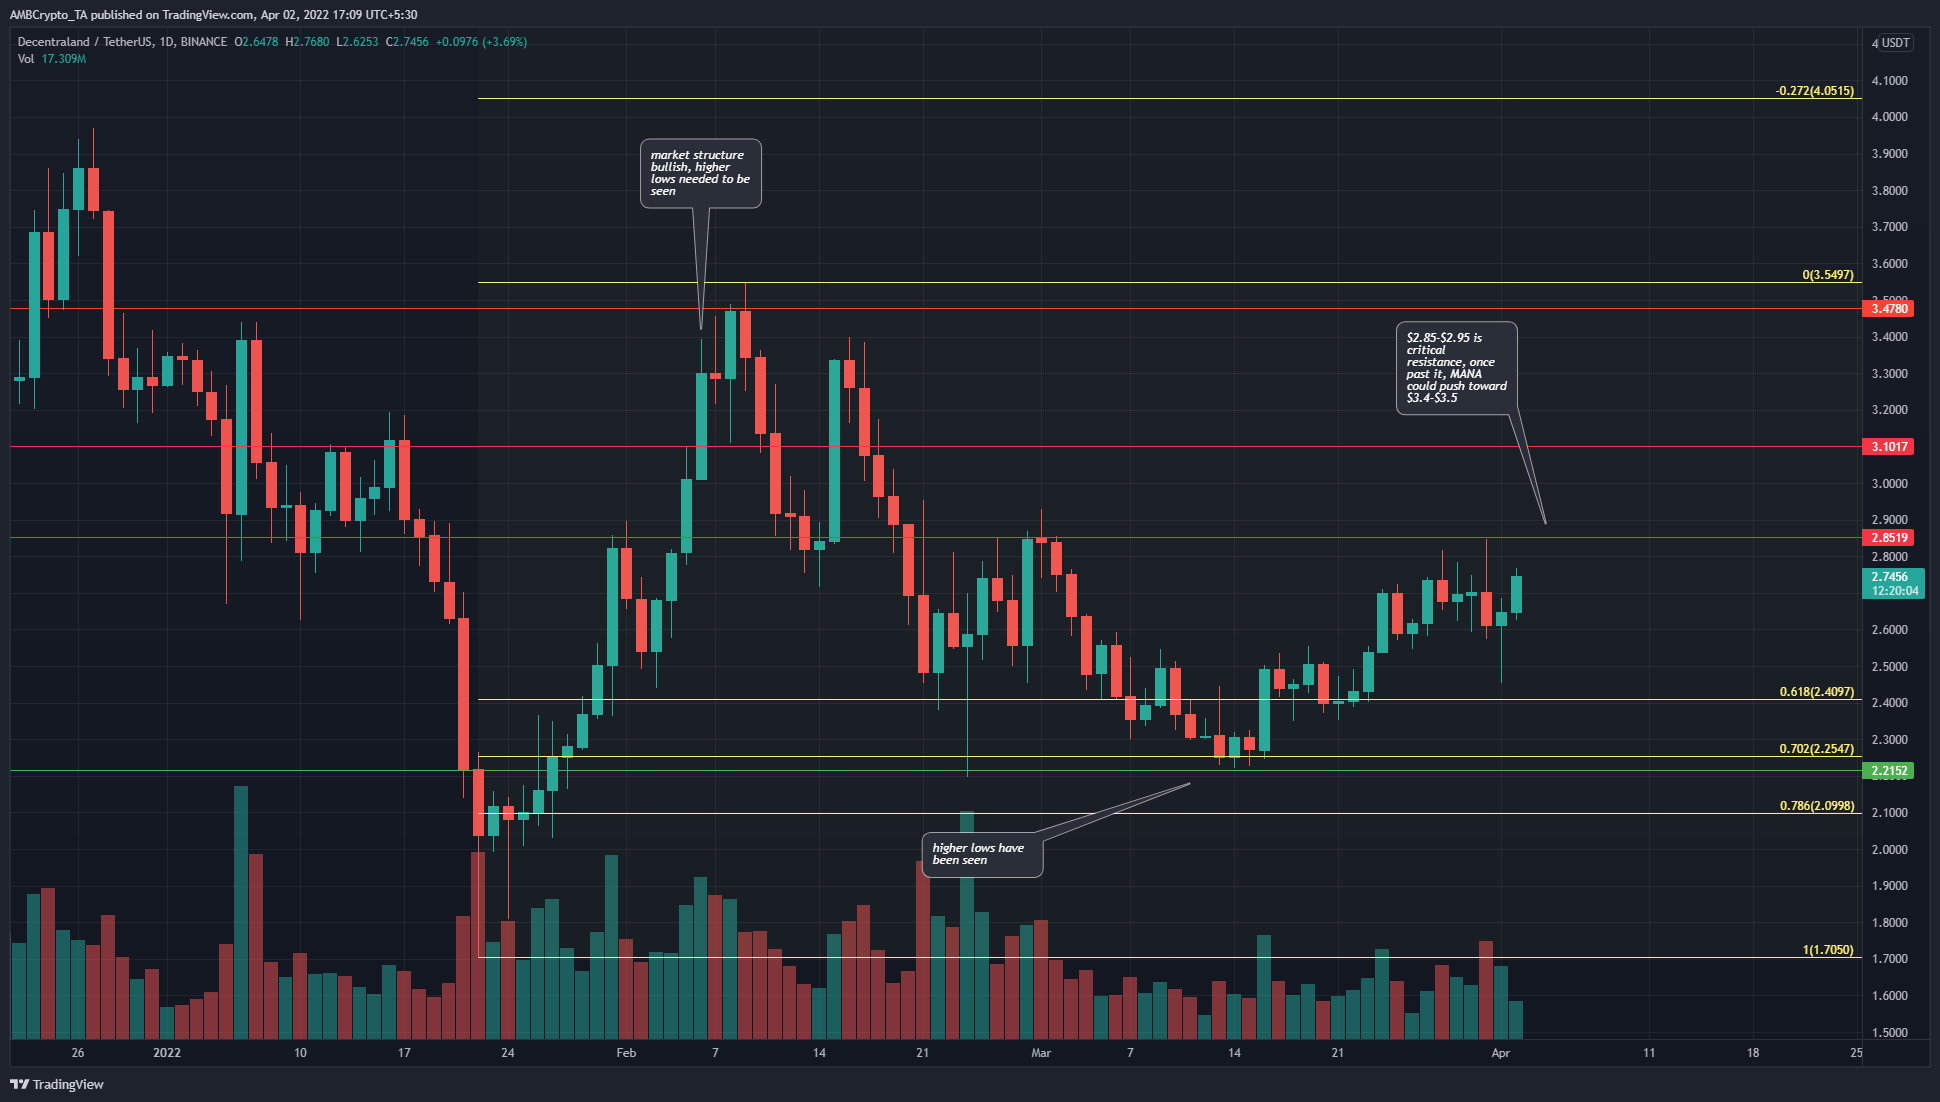
In early and mid-January, the entire crypto market was bleeding as wave after wave of fear hit the market. MANA was no different as its price dropped to the $1.7 lows. However, in the late January to early February rally, MANA bulls managed to break the previously bearish market structure. The $2-$2.1 area acted as a bullish order block, from where the price saw an impulse move to the $3.54 level.
This move was used to plot a set of Fibonacci retracement levels (yellow), and it can be seen that the price has already visited the 61.8% and 70.2% retracement levels.
At the time of writing, the price was moving higher once more after seeing some demand at the $2.4 level. The $2.85-$2.95 area would be a place that bulls would seek to flip to support.
Rationale
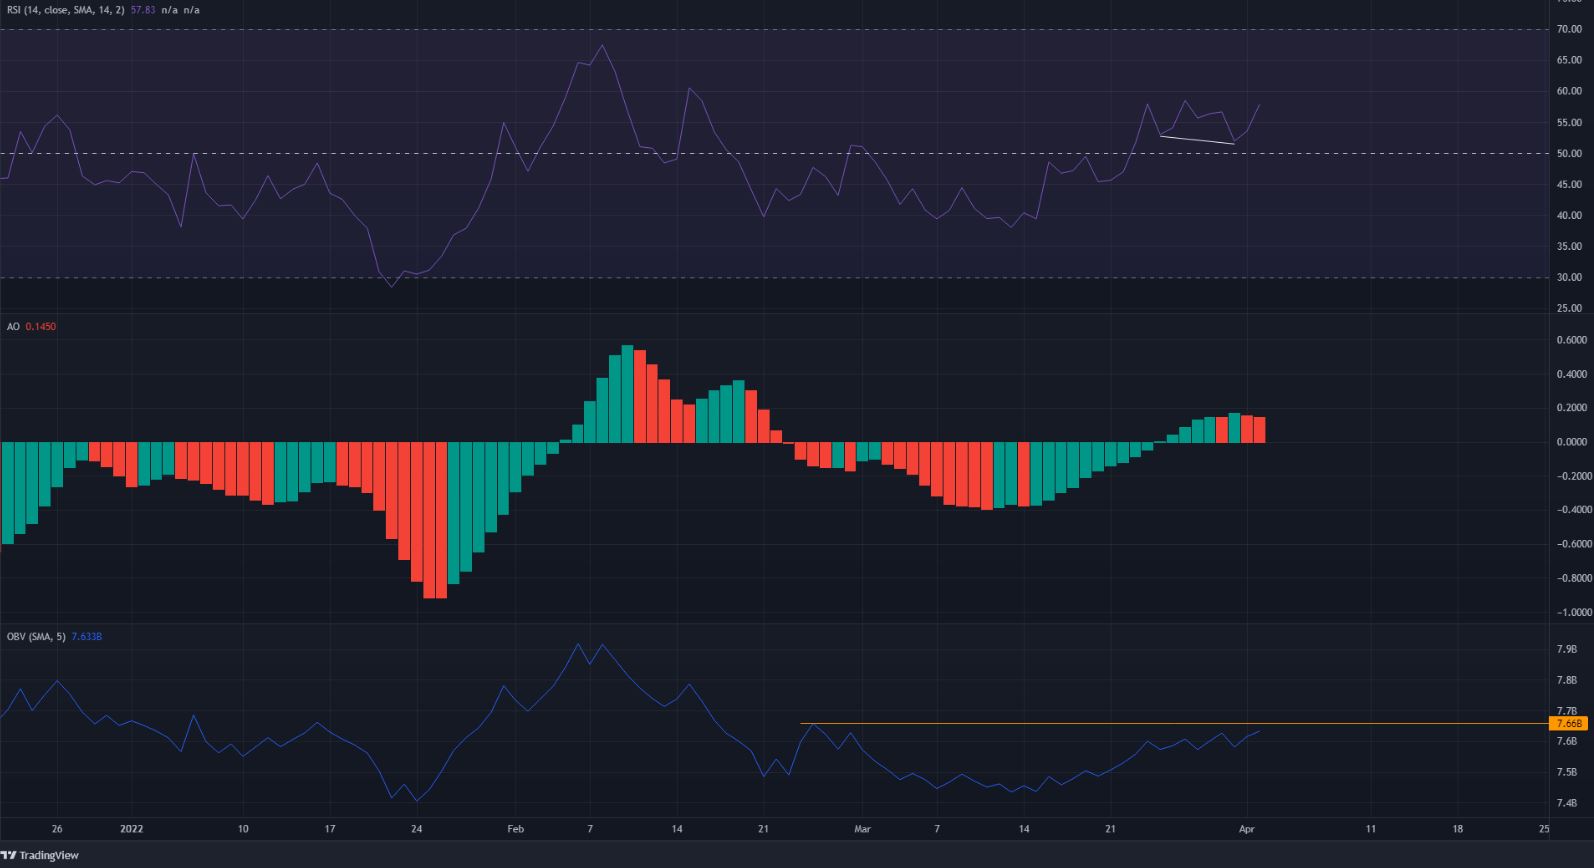
The RSI on the daily chart was above the neutral 50 line and climbing to show that the overall trend was bullish. Moreover, in the last few days, the price made a higher low while the RSI made a lower low. This hidden bullish divergence signified a continuation of the uptrend.
The Awesome Oscillator was also above the zero line but not with great strength yet. The OBV has not had a definitive trend over the past three months. A level marked on the OBV represented the previous highs, and a move above it would signify strong buying pressure.
Conclusion
The indicators showed that further upside was possible, and the technical outlook on the price charts pointed toward a possible move to $3.4 for MANA. In order for that to happen, the $2.85 area needs to be broken and retested as demand. Such a retest could offer buying opportunities.