Analysis

Mantle [MNT] price prediction – Should you use price bounce past $1 to go short?
Posted:
Journalist

- At the time of writing, Mantle seemed to have a bearish swing structure on the weekly timeframe
- Its drop below $1.03 revealed a bearish structure break on the daily chart
Mantle [MNT] saw a 13% price drop on Friday, 21 February. Now, the trading volume has been relatively strong in recent weeks. This suggested that a quick recovery may be unlikely for the altcoin right now.
Mantle’s price action showed multiple bearish signals

Source: MNT/USDT on TradingView
The key swing levels on the weekly timeframe were at $1.51 and $0.56 (white), respectively, for April and January 2024. Since then, MNT has made a (marginally) lower low at $0.549 and a lower high at $1.39 (yellow).
This showed that the weekly swing structure was bearish. The market structure on the daily has also been bearish. The recent drop below $1.03 confirmed a bearish market structure break.
Moreover, the price fell to the 75% level of the former range formation (purple) at $0.83, testing it as support. Over the coming days, the $0.915-$0.956 zone is expected to serve as a supply zone. Swing traders can look for a lower timeframe breakdown to enter short trades.
The technical indicators agreed with this finding. The CMF was at -0.1 and highlighted significant capital outflows. The DMI highlighted a strong bearish trend on the daily charts, with both the ADX and -DI above 20. This agreed with the bearish market structure mentioned previously.
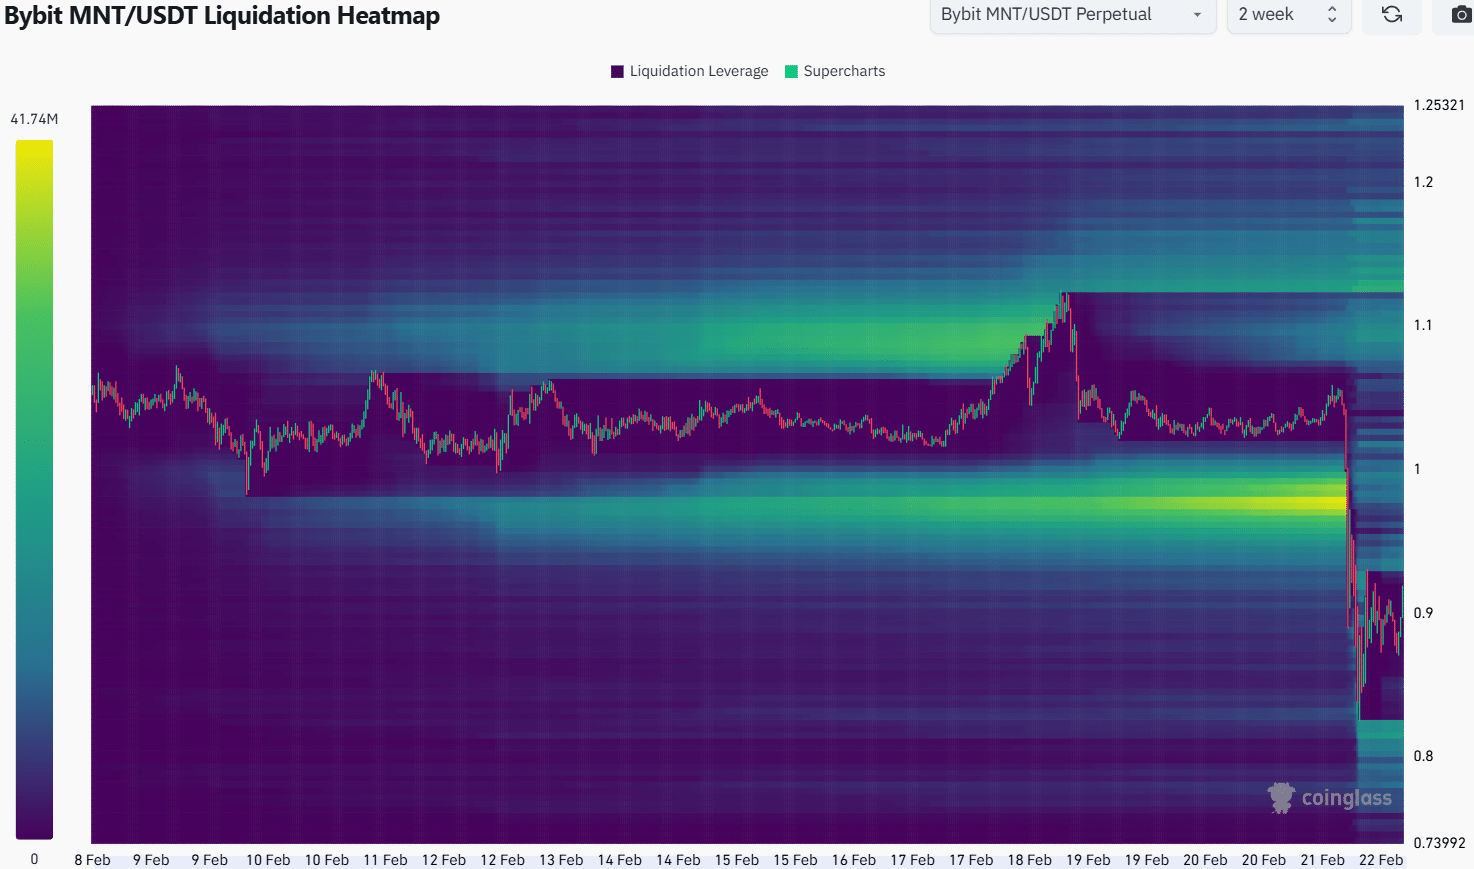
Source: Coinglass
The liquidation heatmap revealed that a cluster of liquidity around $1 was obliterated during the altcoin’s recent losses. This cascade of long liquidations likely contributed to the recent price move to $0.83.
After such a strong move, the price would likely consolidate around the $0.9-mark. This would give time for liquidation levels above and below the price to build. The price can then visit both pockets, before its next impulse move.
It is unclear which one would be tested first, but swing traders can wait for a move towards $0.95-$1.03 before entering. A move beyond $1.1 would invalidate the bearish setup, hence, it can be used to set stop-loss orders.
Disclaimer: The information presented does not constitute financial, investment, trading, or other types of advice and is solely the writer’s opinion