- Mantra is up 133% YTD and rising.
- The recent gains have a pattern of consolidation and expansion on the lower timeframes.
Mantra [OM] has shown unstoppable momentum over the past year. Compared to the price on the 1st of February, OM was up by 8,592%, or nearly 86x at press time. Even from the 1st of January, OM was up by 133%.
This has come at a time when the rest of the market has fallen lower or stayed range-bound, such as Ethereum [ETH] or Bitcoin [BTC]. It has set a series of new all-time highs, with the latest being $9.17.
The psychological $10 level is likely to be breached next.
How high can OM go?
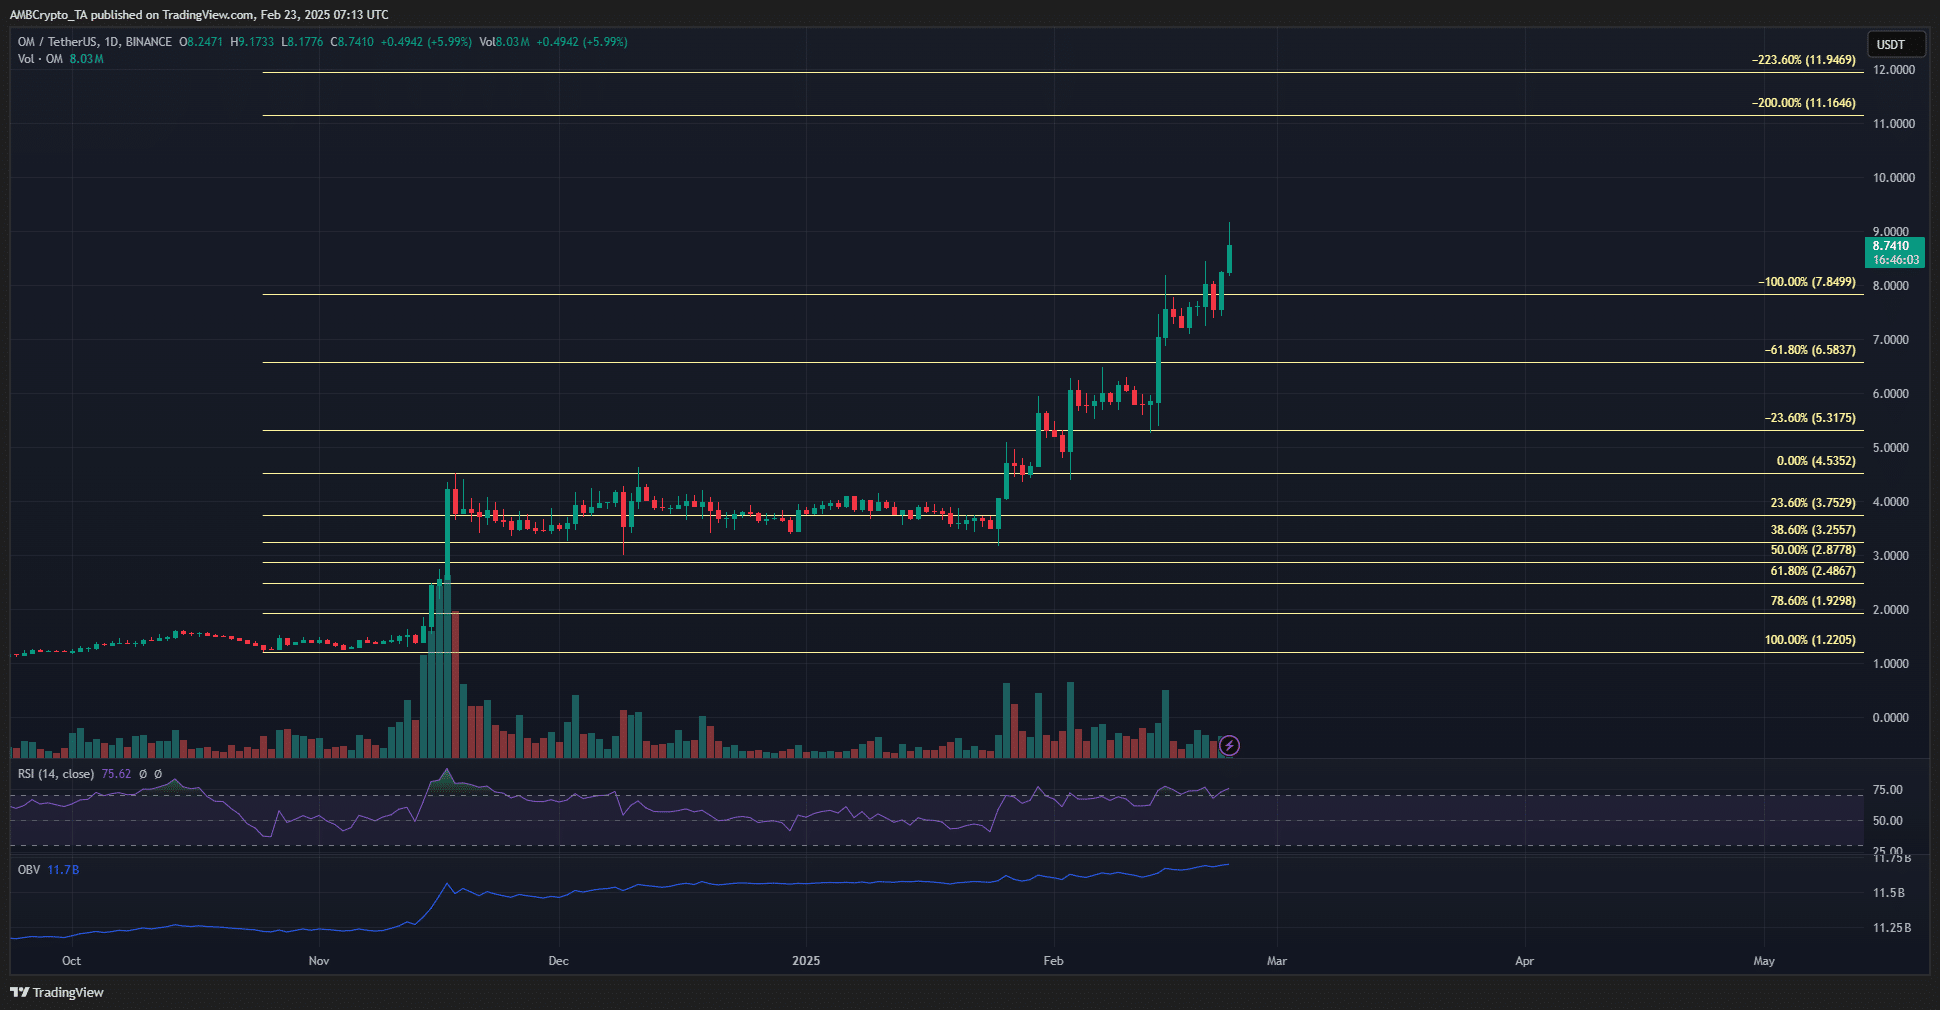
Source: OM/USDT on TradingView
Based on the rally in November, a set of Fibonacci retracement and extension levels were plotted.
Beyond the $4.5 high from that rally, the relevant extension levels at $5.31, $6.58, and $7.84 have acted as both resistance and support.
If this trend continues, the next price targets will be $11.16 and $11.94. Since Mantra has not seen a sizable retracement phase, the extension levels from November continue to serve their purpose.
The RSI did not show a bearish divergence on the daily timeframe, but it was getting closer. The price has formed higher highs, but the RSI struggled to match them.
This could be an early warning of a lower timeframe pullback. Also, the OBV continued to rise higher, showing persistent buying pressure.
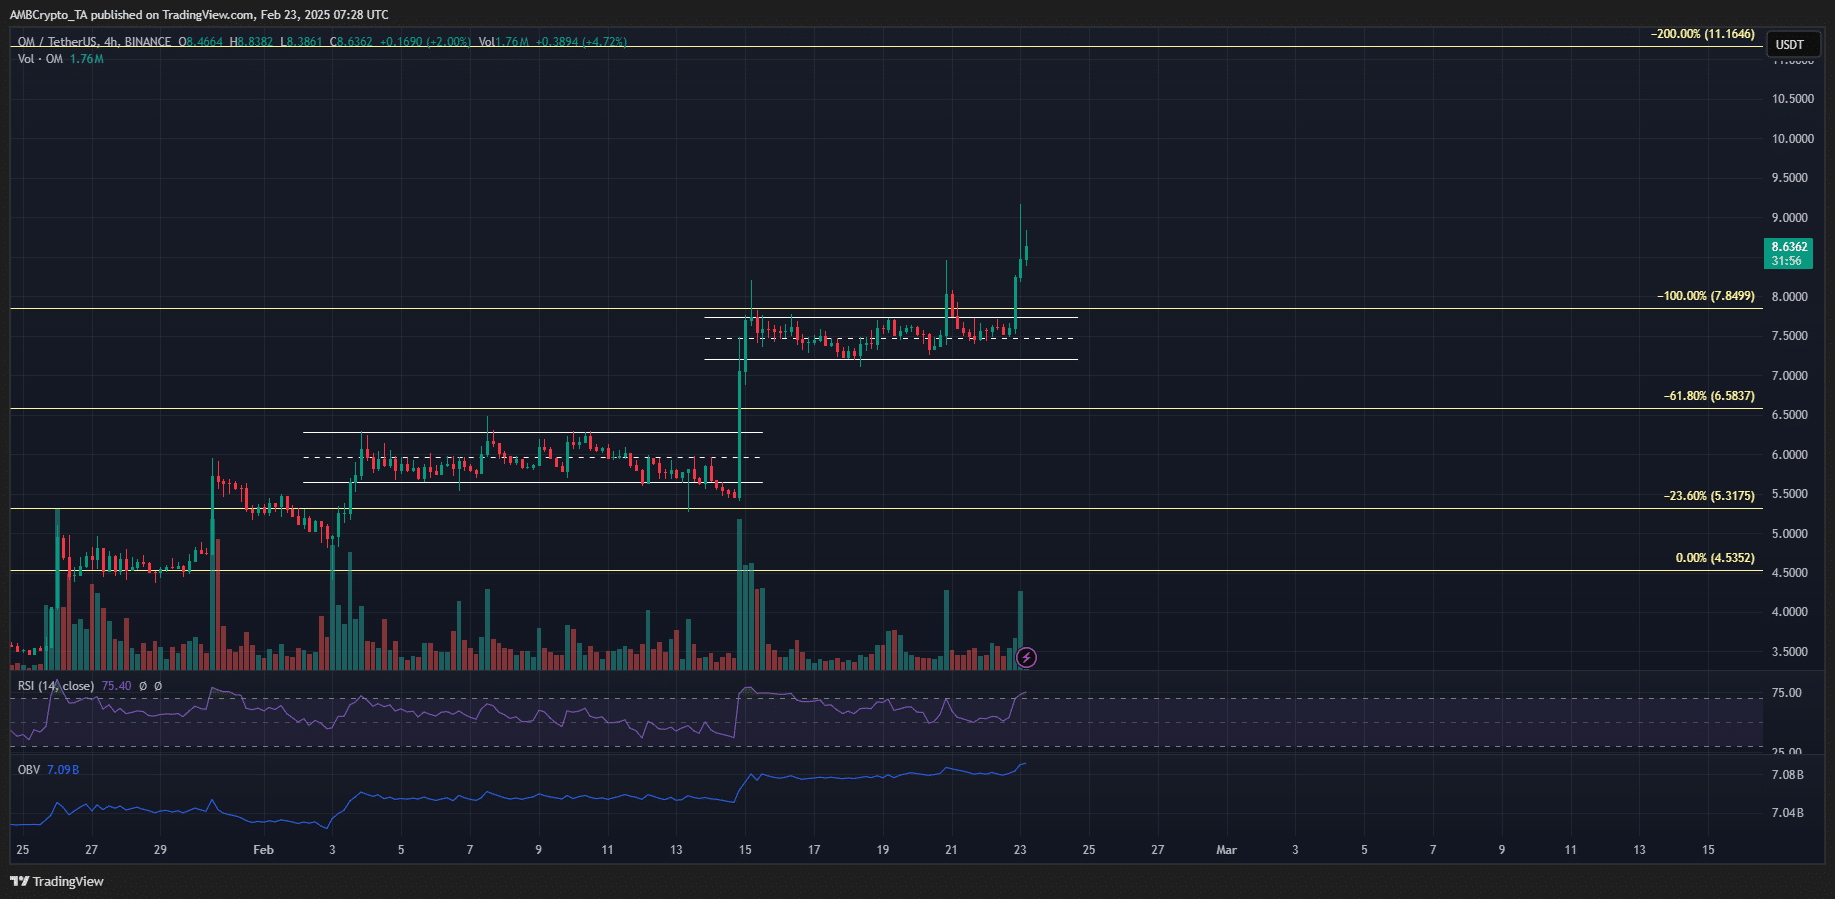
Source: OM/USDT on TradingView
It is possible for traders to capitalize on the relentless OM momentum. The rallies in February were preceded by a range formation, highlighted in white.
In the second week of February, a deviation below the range low was followed by a swift 50% price move.
The range formation which OM broke out of recently originated at the mid-range level.
Hence, traders can wait for the next range formation and try to buy the altcoin at the range lows, after a liquidity pocket has been built and swept.
However, this could prove to be risky, and traders shouldn’t hesitate to cut the trade if the structure began to shift.
Disclaimer: The information presented does not constitute financial, investment, trading, or other types of advice and is solely the writer’s opinion