MANTRA [OM] price prediction – Traders, watch out for these retracement levels!
It is unclear whether OM would retrace, and how deep or long this drop can take it.
![MANTRA [OM] price prediction - Traders, watch out for these retracement levels!](https://ambcrypto.com/wp-content/uploads/2024/11/Mantra-Featured.webp)
- Strength of MANTRA’s surge suggested that further gains may be likely
- Price might not retrace as deep as traders would want or expect
MANTRA [OM] has been trending higher since February. Many periods of consolidation in the past nine months saw the altcoin form a range before it continued the uptrend. It differed from most of the other assets, which had been trending south or sideways since March.
On 14 November, OM broke out past the local highs at $1.62. Since then, it has rallied by 48% on the charts. The swift gains left little time for support levels to be established. Will MANTRA set new highs soon?
OM faced rejection at $2.71 – Is $2 the next short-term target?
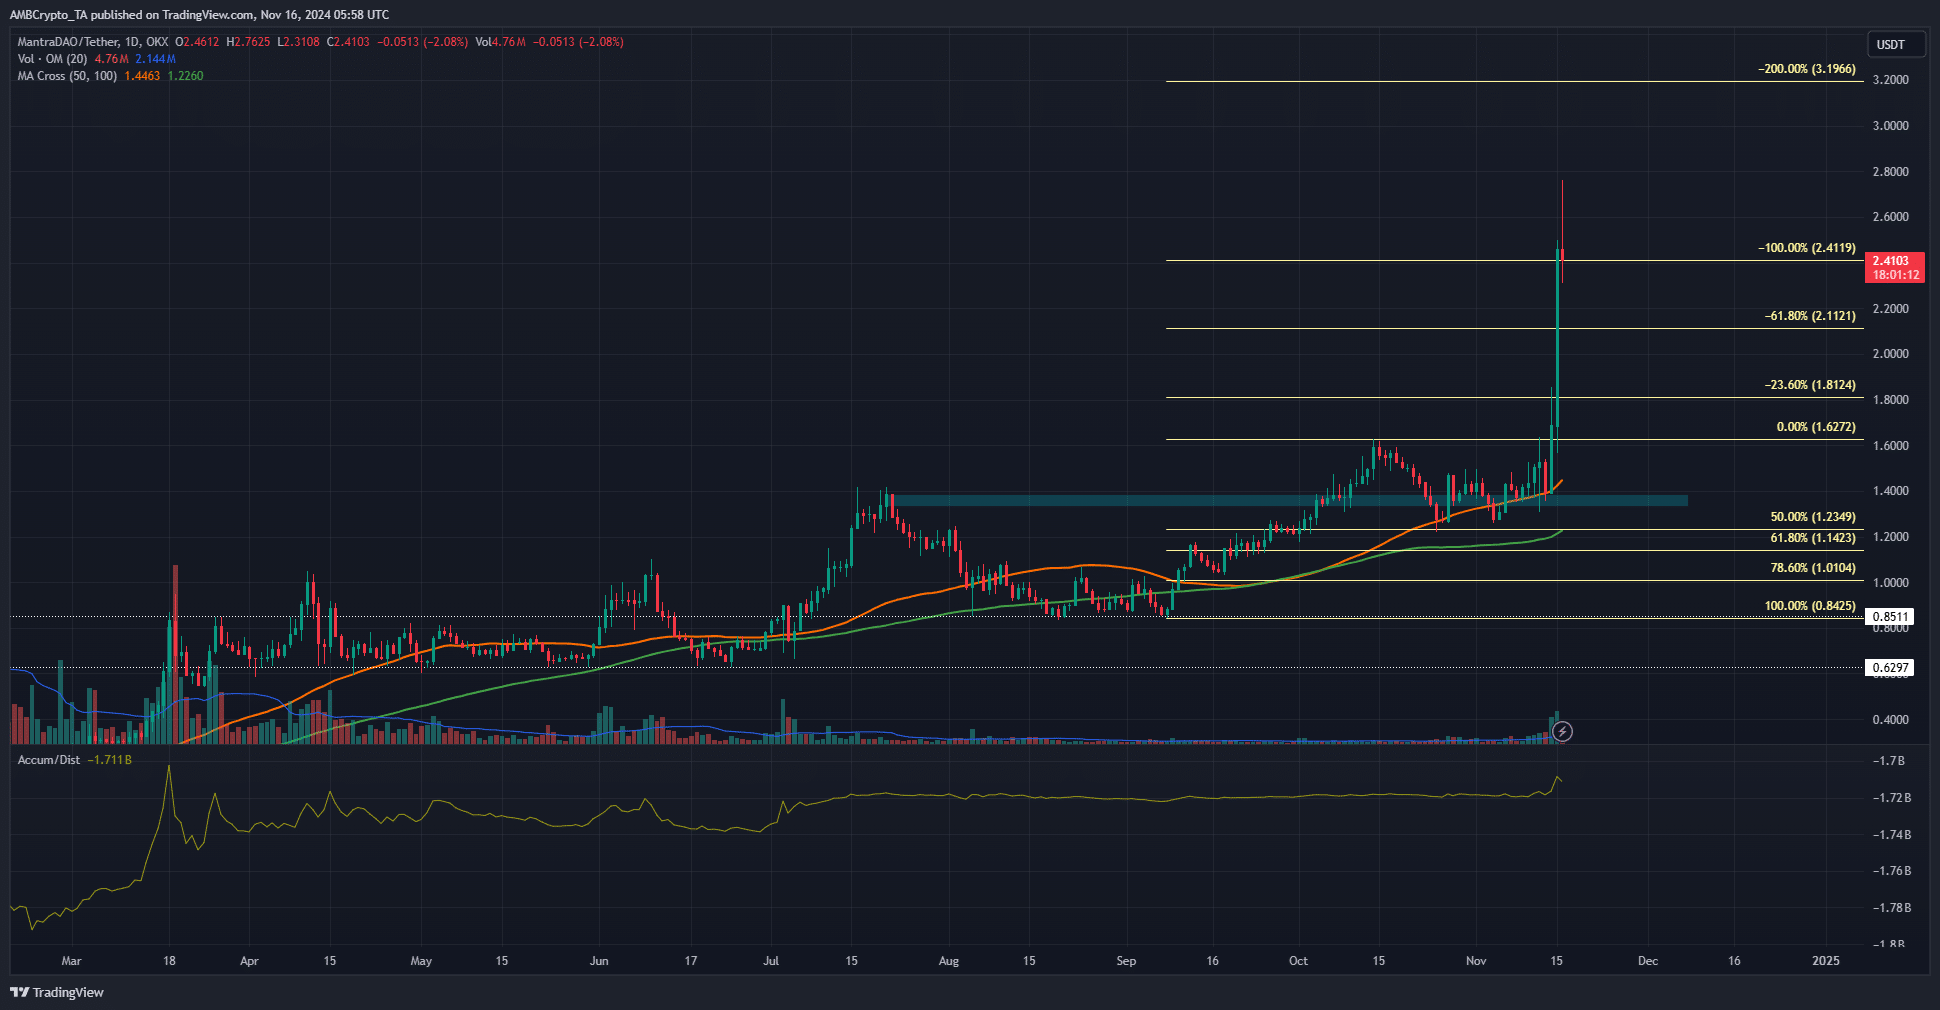
OM gained by 50% in the last 24 hours and set new all-time highs beyond $1.6. The Fibonacci extension levels outlined $2.41 and $3.19 as the targets to the north. At press time, MANTRA had already moved beyond $2.41, but it could face a retracement in the coming days.
Since it is a bull market and sentiment seemed to be enthusiastically bullish, the chances of a deep retracement may be low. A Bitcoin [BTC] plunge of 15% or more within a few days would be necessary to slash altcoin prices by 40%-70%.
At the time of writing, such a deep correction for Bitcoin did not appear likely. Hence, OM traders need to be prepared for further upward momentum.
Short-term support zones MANTRA can visit
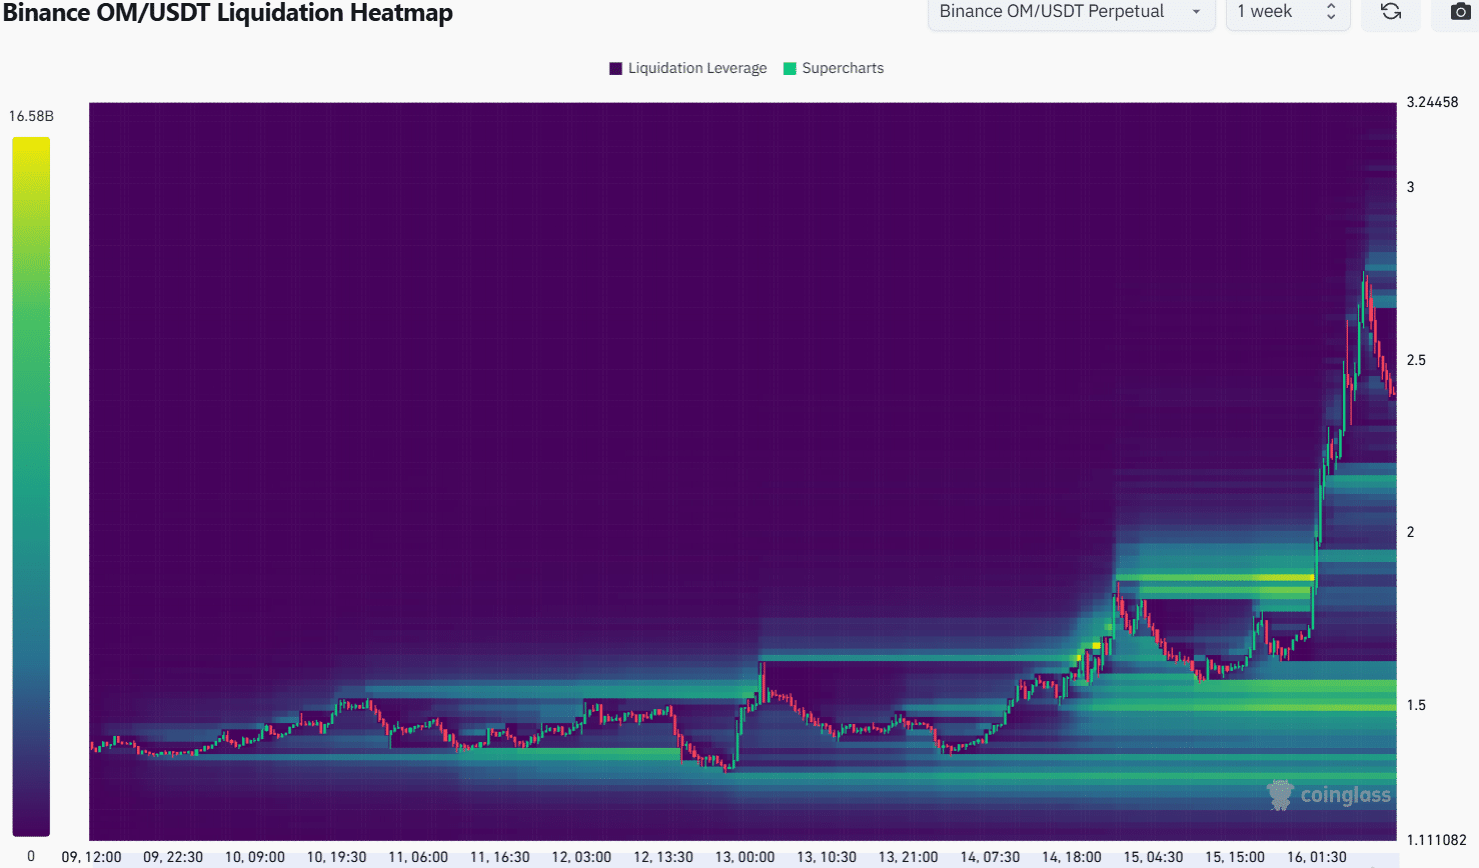
On the 1-week look-back liquidation heatmap, we can see that the $2.14 region has a cluster of liquidity that could drag prices to it.
Since the token has been in a price discovery mode, the liquidity levels didn’t seem to be as dense as the long-term ones.
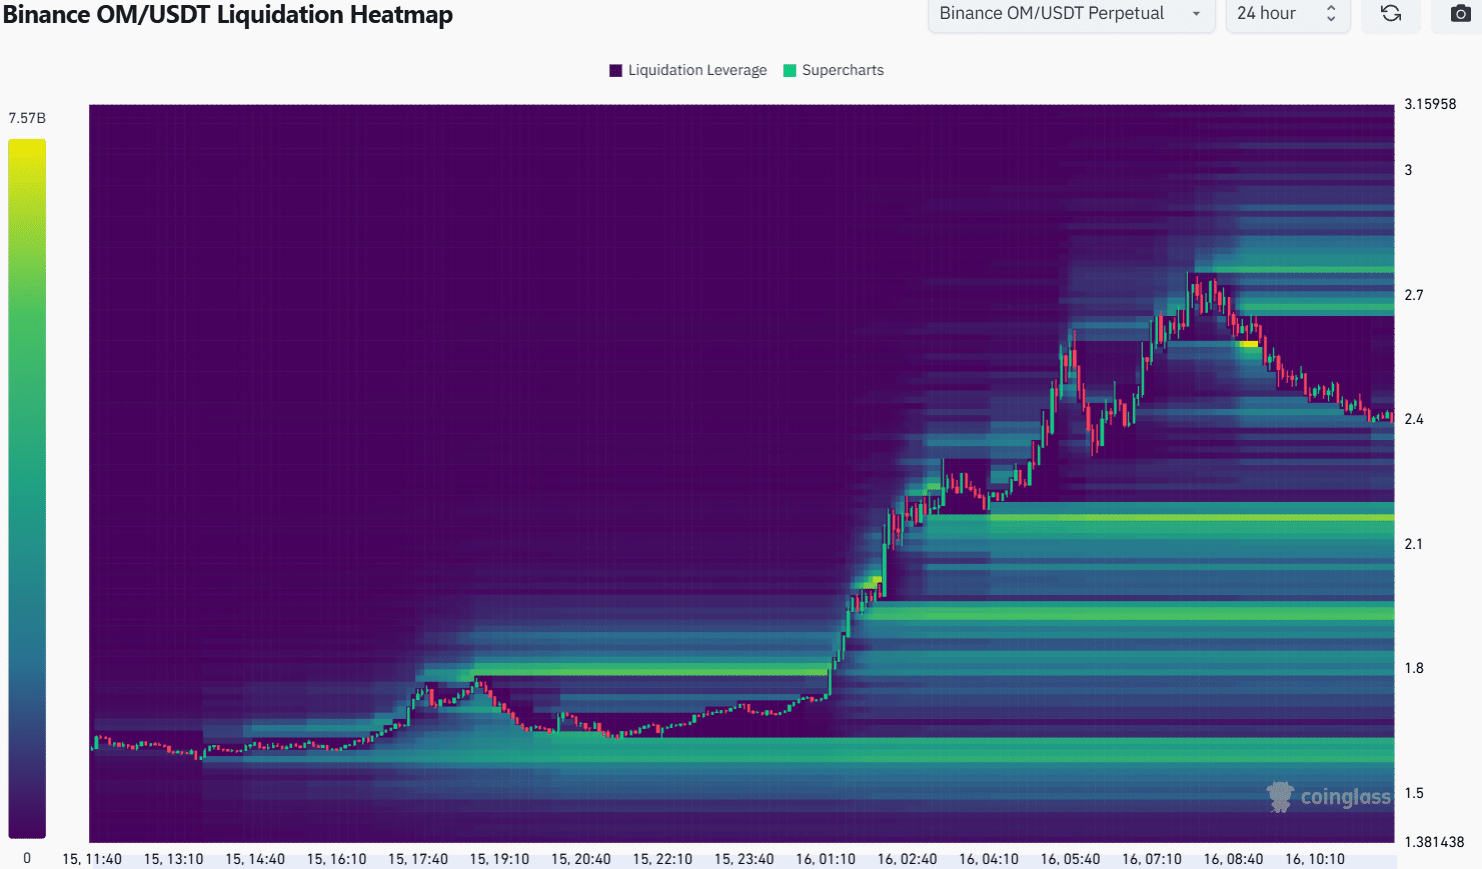
The 24-hour chart also highlighted $2.14 and $1.94 as short-term support zones which MANTRA can rebound from. The highs around $2.7 also saw a build-up of short liquidation levels.
Read MANTRA’s [OM] Price Prediction 2024-25
It is unclear whether OM would retrace, and how deep or long this drop can take it. The $2.14 and the $2 psychological level would be attractive for buyers.
With BTC retaining its upward momentum, OM may be likely to maintain its upward trajectory.
Disclaimer: The information presented does not constitute financial, investment, trading, or other types of advice and is solely the writer’s opinion.


![Why Plasma [XPL] is falling despite holding above major support levels](https://ambcrypto.com/wp-content/uploads/2026/06/Erastus-14-e1781862756783.jpg)