
Cardano’s rally intact! – But THIS could stall ADA’s $1.15 hopes

- PEPE recovered well, bouncing back from its crucial support and climbing above its key EMAs
- Derivates data suggested mixed sentiment, implying a cautiously optimistic approach
PEPE recently found strong support at the $0.0000067 level, sparking a nearly 62% bullish rebound over the past month. PEPE was trading at $0.0000106, at the time of writing, just shy of the key resistance level at $0.0000109.
The memecoin managed to break above crucial EMAs, but the question remains – Can PEPE sustain its upward trajectory?
Recent price action showed a strong bullish edge
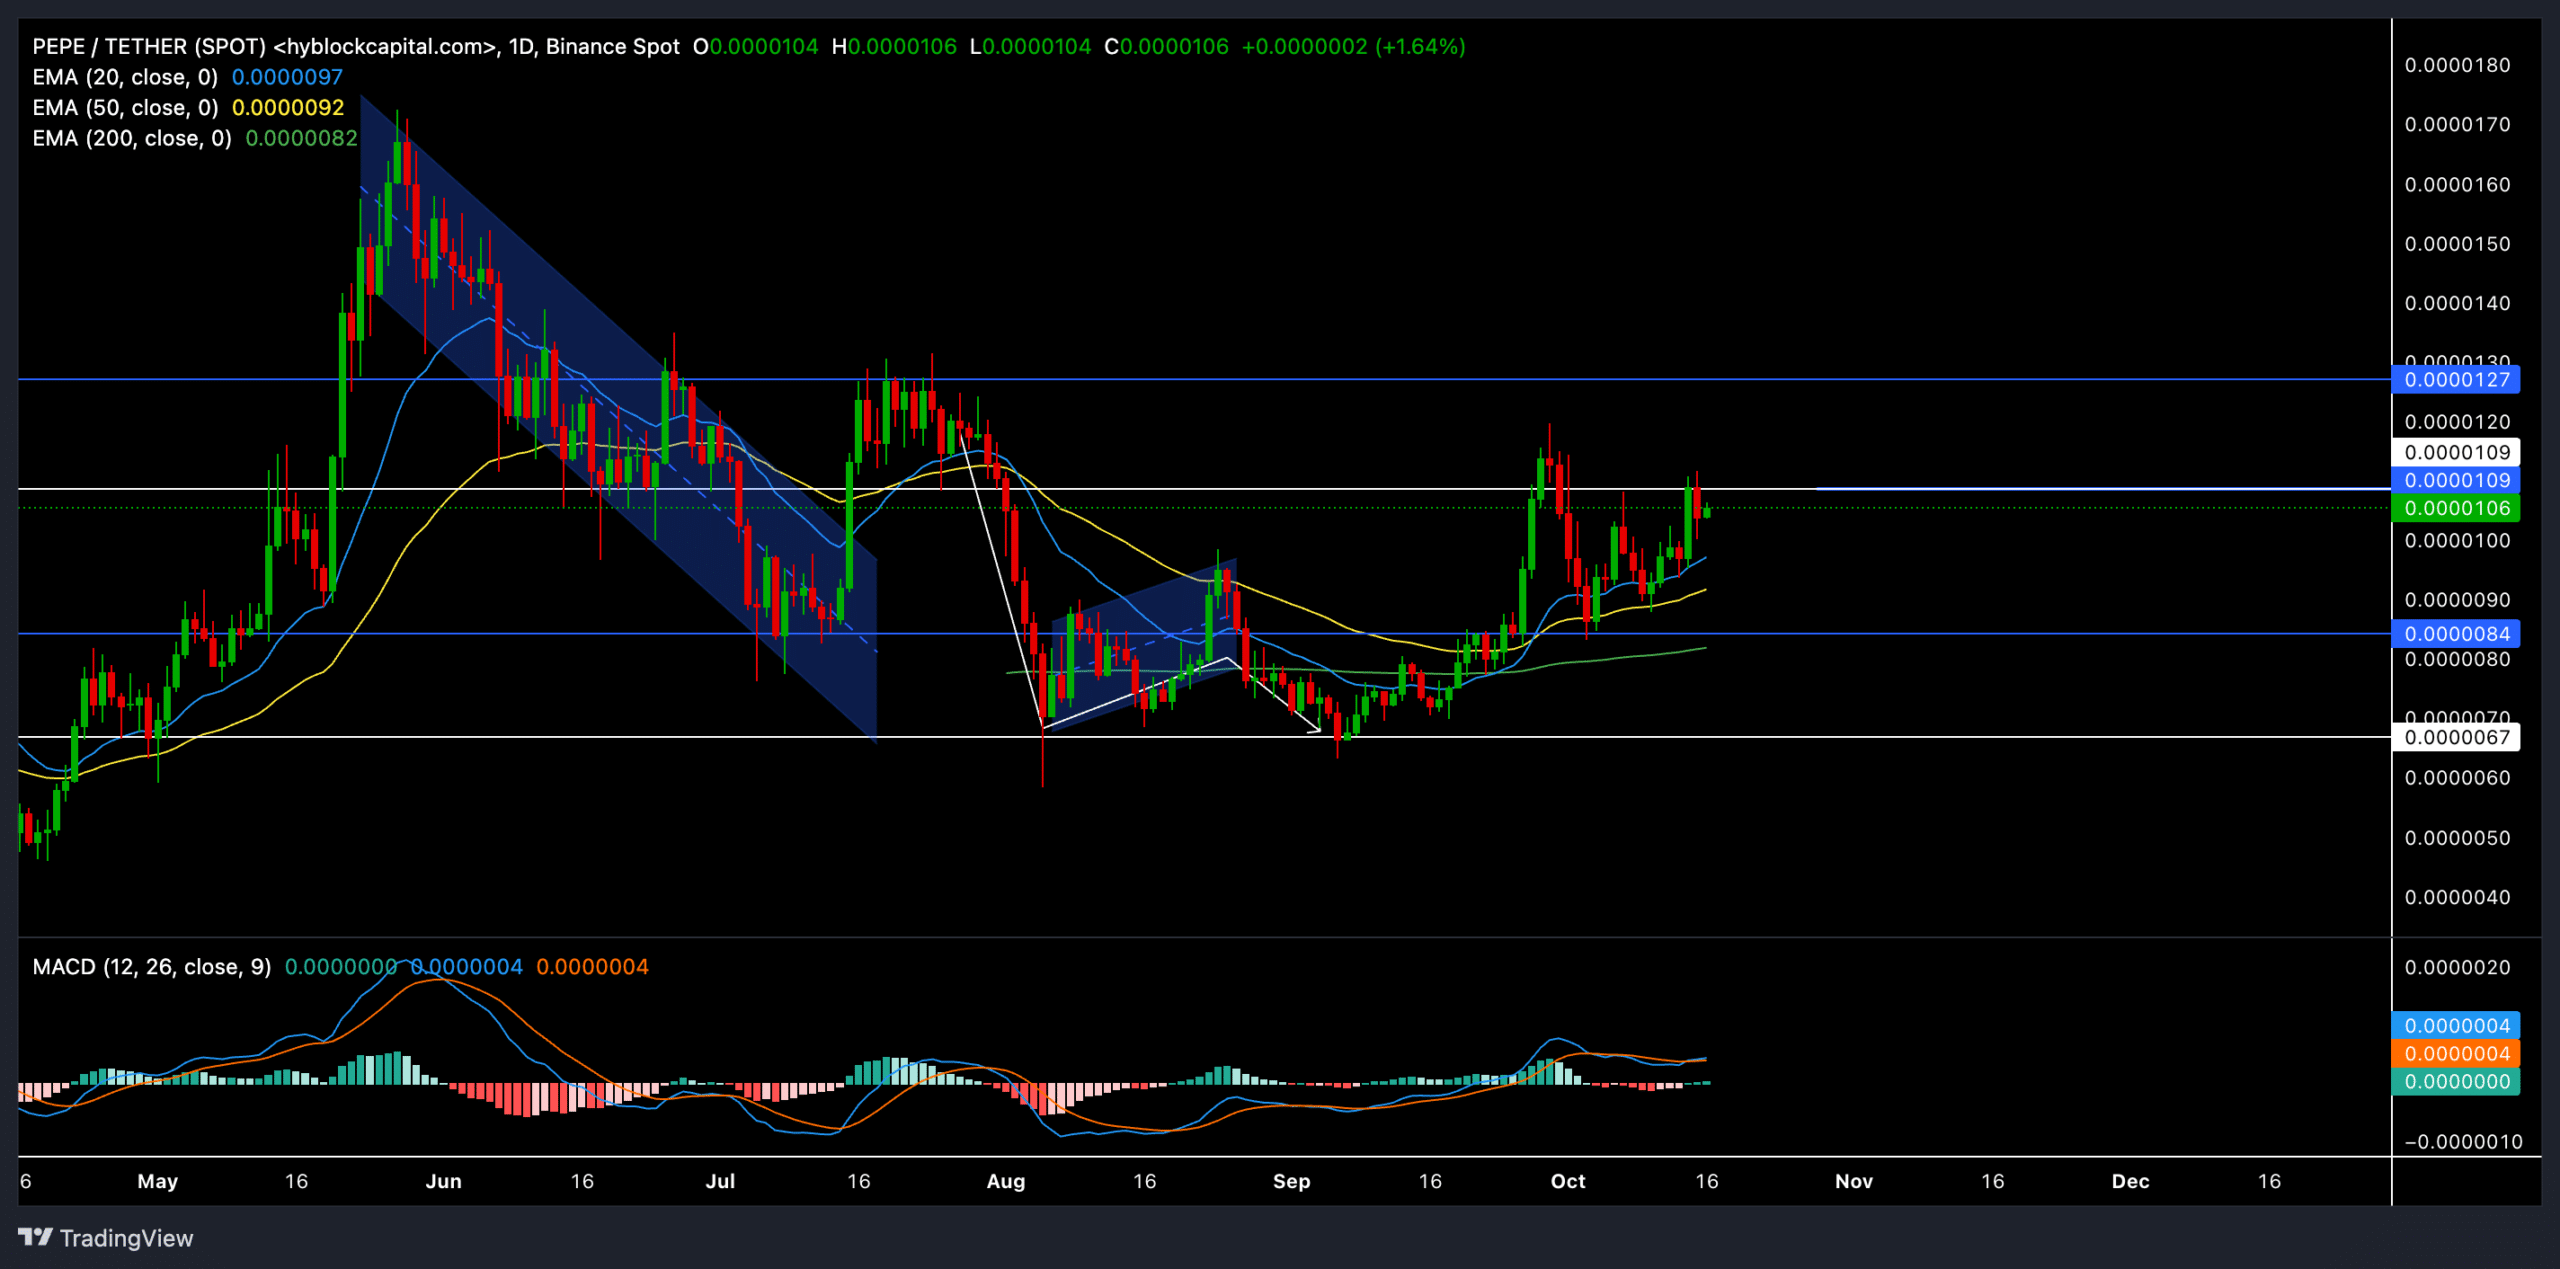
Source: TradingView, PEPE/USDT
Since breaking down from a bearish flag, PEPE found firm support at the $0.0000067 level, which set the stage for an impressive rally. The price jumped above the 20-day, 50-day, and 200-day EMAs to signal a strong bullish edge.
The memecoin’s recent price action has been choppy around this resistance as bulls attempted to push PEPE above it for a more extended rally. A decisive close above $0.0000109 could set the stage for buyers to aim for the $0.0000127 resistance level in the coming sessions.
The MACD (Moving Average Convergence Divergence) indicator recently crossed into bullish territory, with the MACD line crossing above the Signal line – Indicating a positive momentum shift. This crossover pointed to the higher likelihood of sustained bullish activity, particularly if the bulls can breach its press time resistance.
Key levels to watch
Support: The $0.0000084 level remains a critical support that helped the bulls regain footing. Any dip towards this level could present a potential buying opportunity.
Resistance: The immediate resistance stands at $0.0000109. A break above this level could open the doors for a retest of the $0.0000127 resistance in the coming sessions.
Derivatives data and sentiment

Source: Coinglass
Looking at the derivatives data, PEPE’s Open Interest rose by 0.13%, indicating a slight uptick in trader interest. However, the trading volume saw a significant drop of 35.05%, alluding to weak market activity after its most recent rally.
The long/short ratio on OKX was 2.42, underlining a predominantly bullish sentiment among traders on the platform. Interestingly, Binance PEPE/USDT also highlighted a balanced long/short ratio of 0.9516 over the last 24 hours – A sign of cautious optimism within the market.
Here, it’s worth noting that the 12-hour liquidation data revealed more liquidations on the short side, suggesting that sellers are finding it challenging to hold their positions. Especially as the price pushes higher.
Finally, traders should also track Bitcoin’s movements and assess the overall sentiment before opening a long or short position.


