Mapping the Bitcoin Rainbow Chart – Where will BTC’s market bottom occur?
Traders and investors must remember that the Rainbow Chart has its limitations.

Bitcoin [BTC] has gotten June off to a remarkable start. Within five days, the price has dropped by 14.4%. The first three days of the month saw a cumulative $1.399 billion in outflows from Spot exchange-traded funds (ETFs).

In a post on X, Ali Martinez used Glassnode data to demonstrate that Bitcoin had lost control of the $72.4k level. This level was one of the pricing bands derived from the MVRV ratio. Specifically, it was the -0.5σ, or half a standard deviation below the mean at $94.1k.
The next major support zones lie around $54k and $50k, which agrees with the $51k forecast AMBCrypto had made recently.
The sustained pressure on Bitcoin has led to massive liquidations. The $60k support, based on the February crash’s lows, was about to be tested and could lead to a capitulation event.
The Bitcoin Rainbow Chart shows gloom at its peak
Popular crypto commentary account Altcoin Daily observed that the price of Bitcoin has fallen below the Rainbow Chart once again.
This tool is more of a fun chart that uses logarithmic regression to plot price trends, rather than a metric with which to make serious financial decisions.
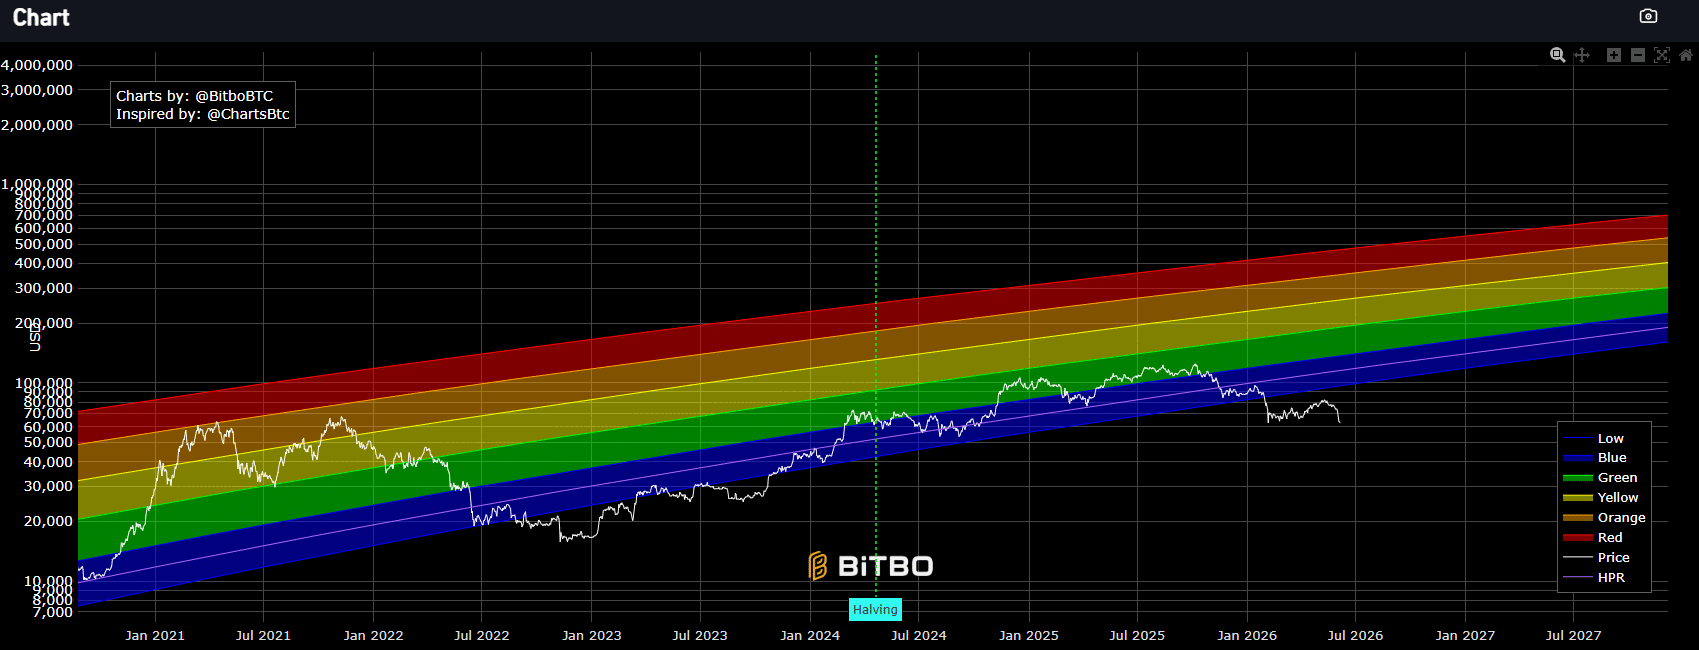
In September 2022, Bitcoin dived below the lower confines of the Rainbow Chart. It stayed there for just over a year before the bull run resumed. More recently, according to the chart above, BTC lost the rainbow in February 2026.
It should be noted that the Rainbow Chart was not made to take evolving cycles into account. As crypto and Bitcoin matured as a market, the volatility in their nascency has been falling.
Each cycle’s peak has extended not further, in terms of percentage, than the one that came before it.
This is to be expected as an asset’s market cap grows. BTC has also had many developments, such as spot ETFs and institutional holdings. Saylor’s long-term bet involved raising debt to buy BTC, effectively making MSTR a leveraged Bitcoin ETF.
Investors must remain nimble in their analysis and appreciate the Bitcoin Rainbow Chart for what it is—a projection, not an accurate forecasting model.
Final Summary
- Bitcoin has fallen below the lower bands of the Rainbow Chart, like it did during the 2022 bear market.
- The on-chain metrics and market sentiment suggested a drop toward $51k is possible later in 2026.


![Assessing Sonic's [S] 12% price drop and why more selling may be next](https://ambcrypto.com/wp-content/uploads/2026/06/IMG_3686-e1782398976520.webp)