MATIC, Binance Coin, Bitcoin Price Analysis: 17 May

MATIC’s uptrend lost steam over the last 24 hours but an extended rally was possible if buyers responded at $1.60. Binance Coin indicated further weakening and could dip towards $450. Finally, buyers could return to the Bitcoin market.
MATIC
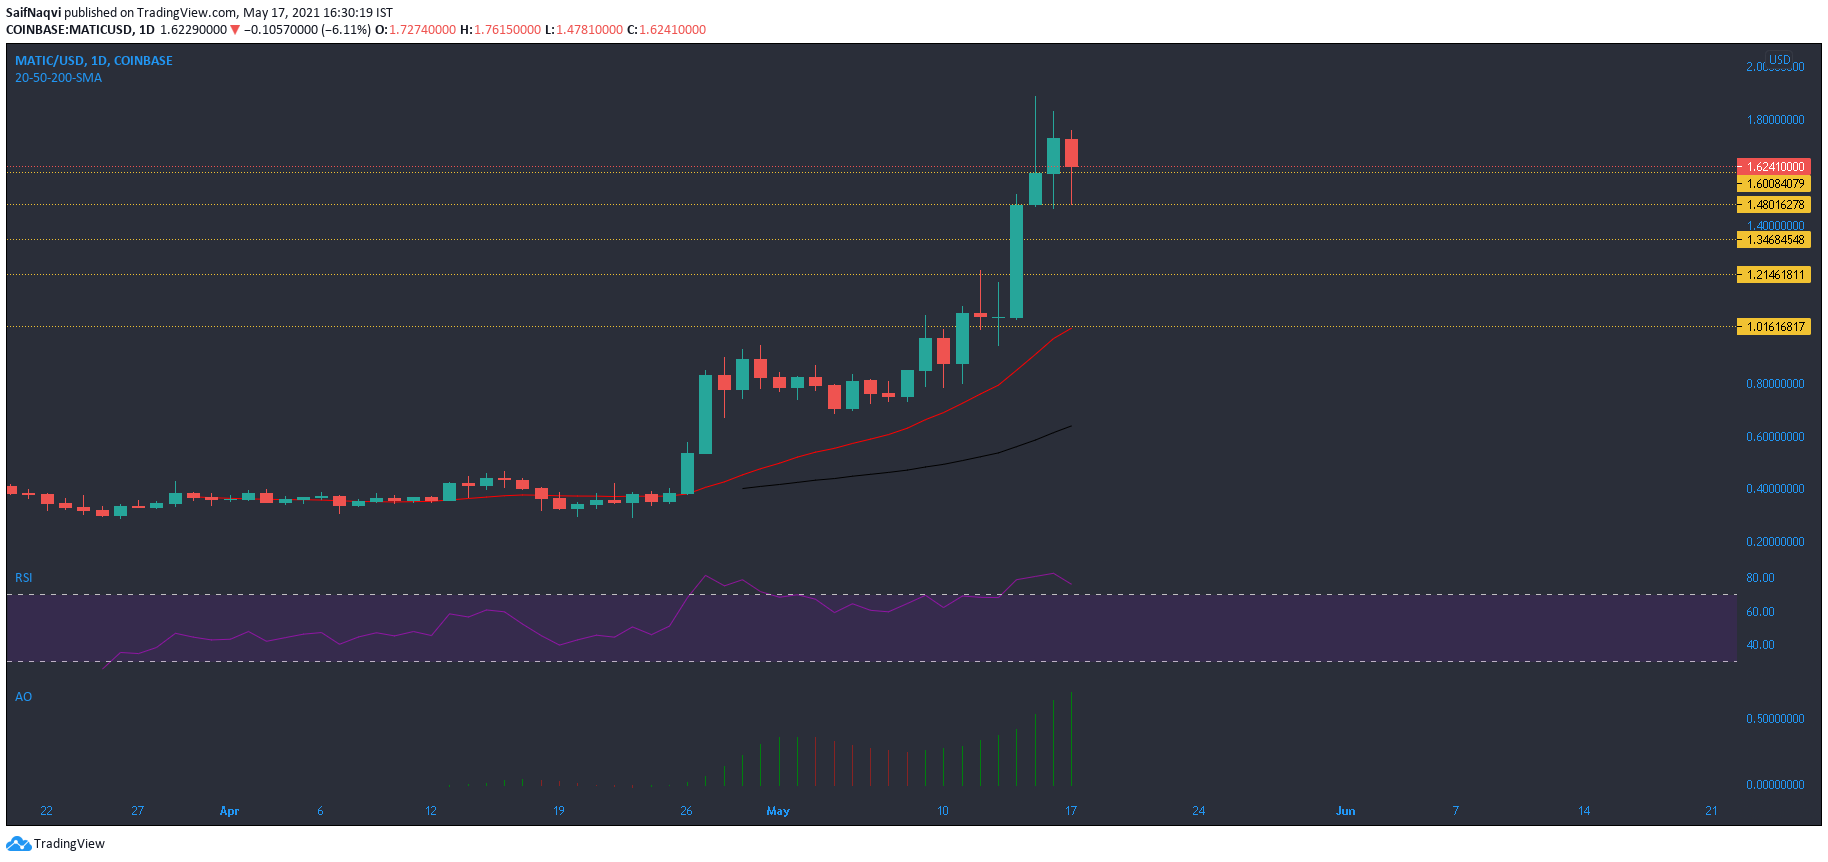
MATIC was in cooldown mode after an impressive run that reflected weekly returns of over 80%. During its rally, several support zones were discovered and some of them rested at $1.60, $1.48, and $1.36. If these levels are breached, a fall could take place towards the $1-mark. This buy zone was bolstered by 20-SMA (red) on the daily chart.
Overall, this movement would indicate a 35% retracement from the present support mark to the short-term moving average. If losses are maintained till $1.48, expect some rangebound movement before volumes pick up once again. RSI pointed south in the overbought territory and indicated some more southbound action before stabilization. Buying pressure was still high according to Awesome Oscillator and an extended bull run would be on the cards if bulls swiftly respond at $1.60.
Binance Coin [BNB]
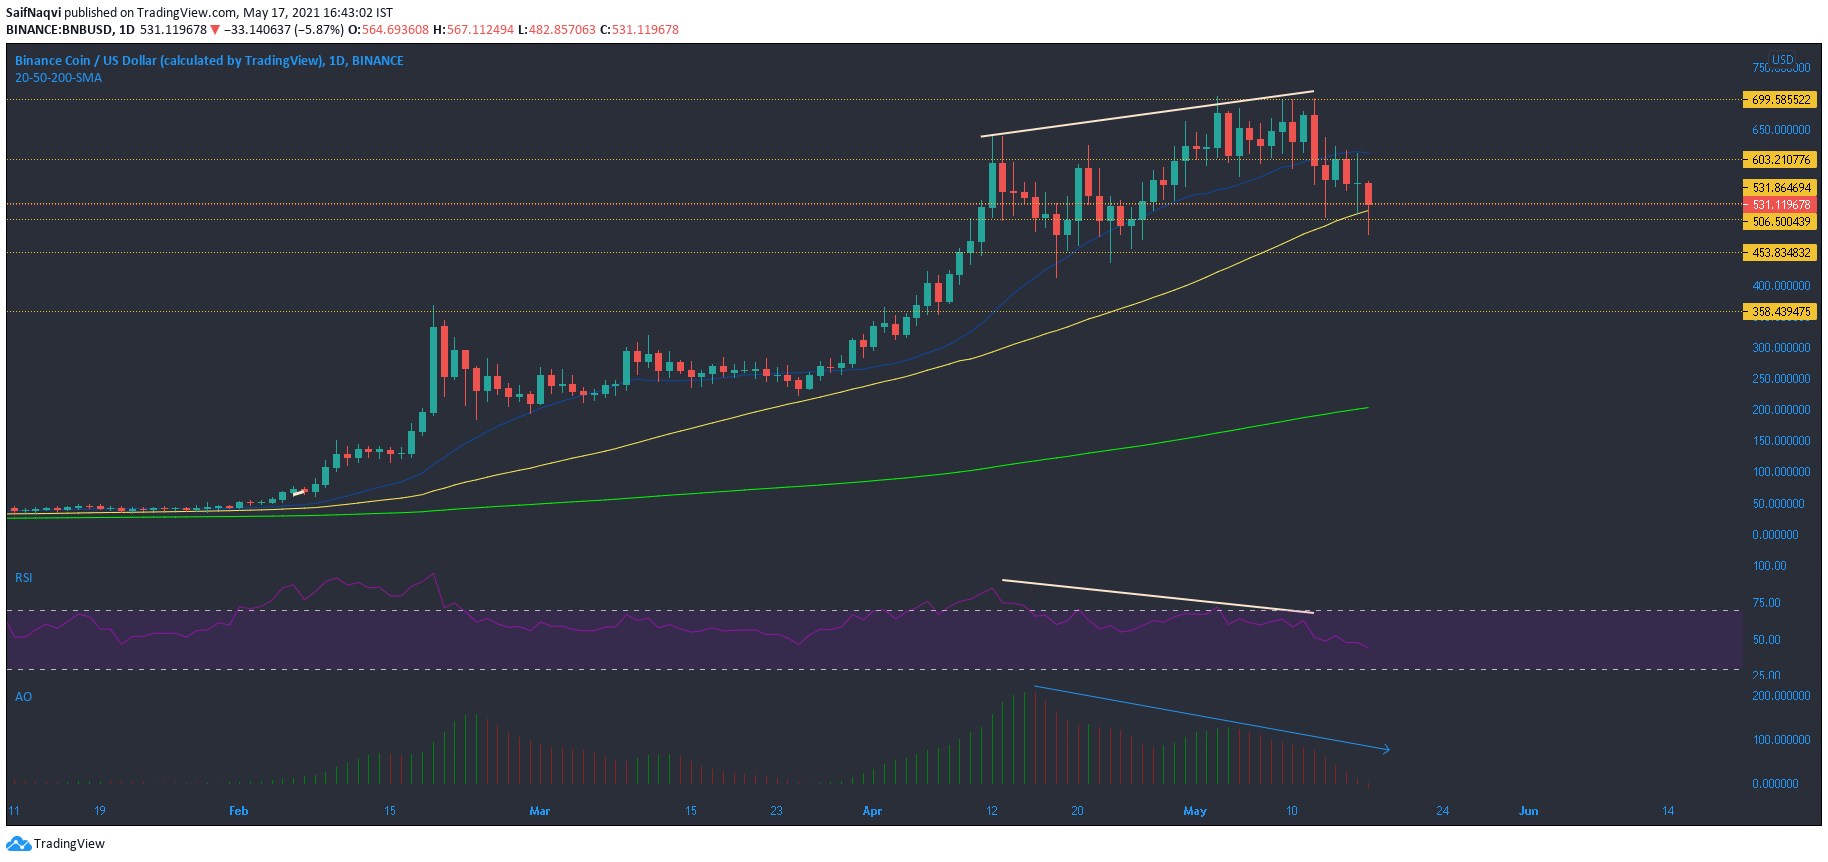
On the daily chart, Binance Coin traded within a critical defensive zone between $531.8 and $506.5. Importantly, this area clashed with the 50-SMA (yellow) and strengthened its defense. A breakdown from this level could lead to additional losses towards $450. A look at the 4-hour timeframe already highlighted a breakdown from the 200-SMA. Since the breakdown occurred on high volumes, BNB could trend in a southbound direction over the coming days.
RSI formed lower highs and highlighted a bearish divergence with the price. Awesome Oscillator made a bearish twin peak and moved below half-line. Conversely, a price hike could be initiated if bulls reclaim the region above $600 and the 20-SMA (blue).
Bitcoin [BTC]
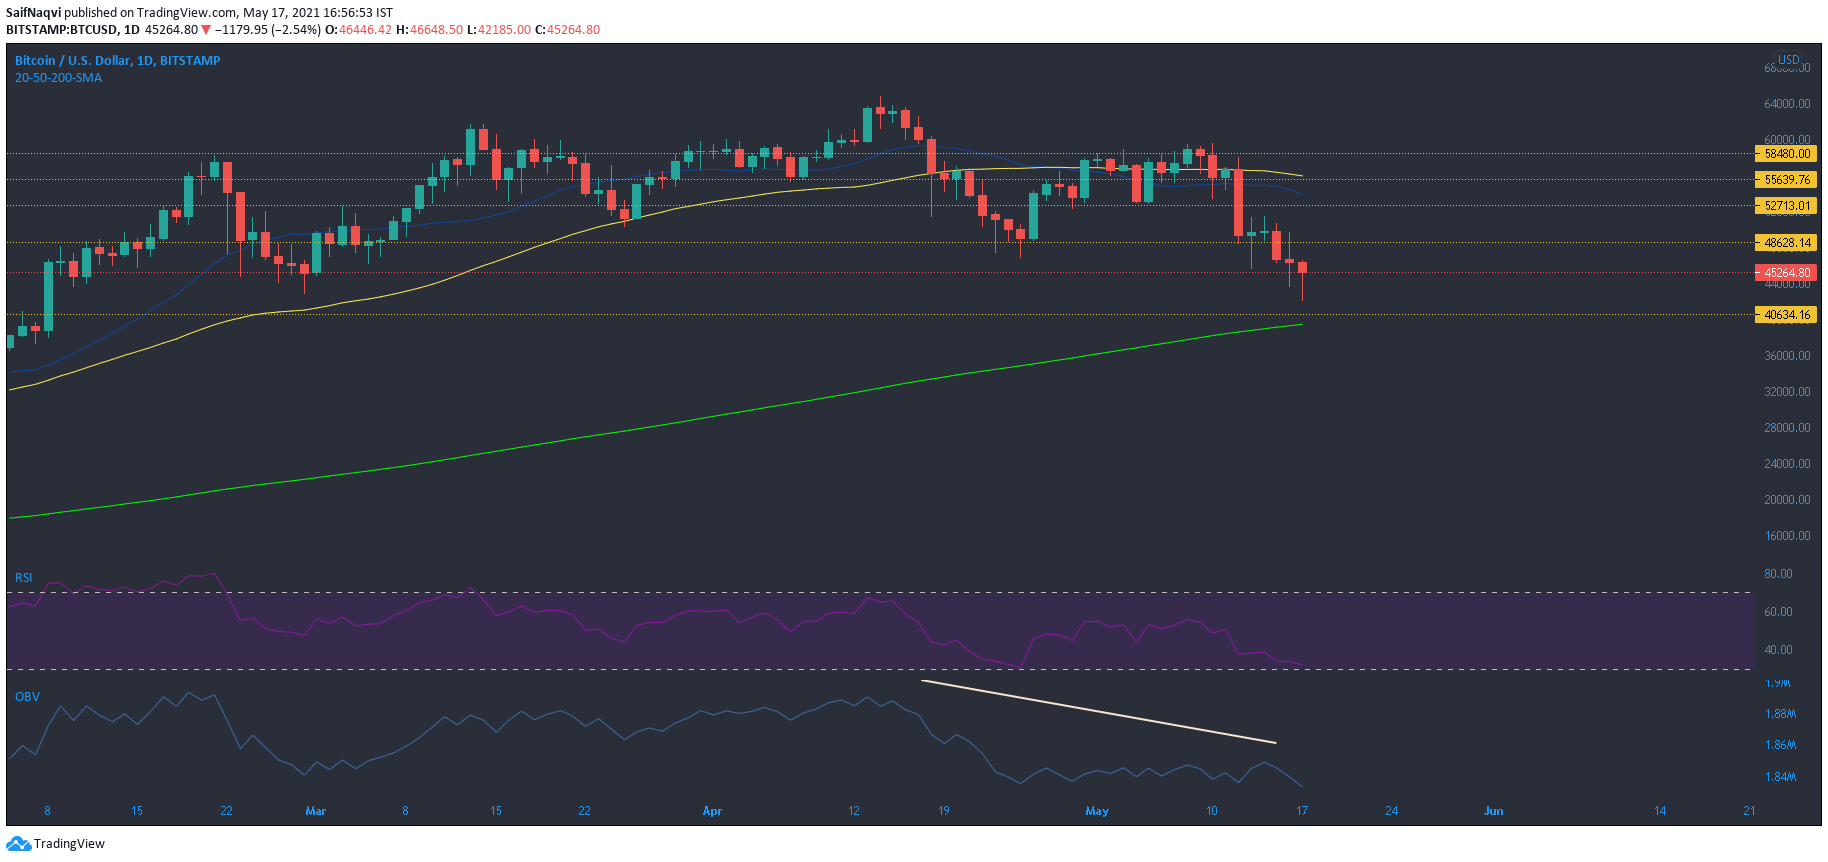
Weekly losses amounted to 22% as Bitcoin traded at $44,800 at the time of writing. Now below its 20-SMA and 50-SMA, BTC could see another dip towards the $40,000-mark. Interestingly, this area coincided with the 200-SMA (green) and opened doors for long-term traders. With the value of BTC expected to surge over the coming months, entering at $40K was a bargain.
RSI moved south and towards the oversold region- an indication of severe bullish weakness. This was largely due to the result of profit taking after BTC snapped an ATH above $64,000. The same was highlighted by lower lows on OBV. For a comeback, bulls needed to target key resistance levels at $50,000 and $55,600. Reclaiming these areas could trigger the next BTC bull run.
![UPbit lists Derive [DRV] across KRW, BTC, and USDT markets - Will demand follow?](https://ambcrypto.com/wp-content/uploads/2026/07/Lazaro-2026-07-14T110021.781.jpg)