MATIC bounces from $0.82 but rejection can be expected at…
The $0.9-$1 area was filled with areas where sellers are expected to be strong, and the prevalent downtrend meant a retest of these levels could offer shorting opportunities.

Disclaimer: The information presented does not constitute financial, investment, trading, or other types of advice and is solely the writer’s opinion.
- The H4 bearish breaker would likely offer intense resistance upon a retest.
- The FVG in the $0.92 area was also something to watch out for.
MATIC saw another leg down on the price charts after the bulls’ failure to defend the critical support at $0.95. This zone had a confluence of technical and longer-term horizontal levels of support but the bears were too strong.
Is your portfolio green? Check the Polygon Profit Calculator
With Bitcoin beneath the $27.8k mark as well, it was likely that more losses could follow after a minor bounce in prices over the weekend. MATIC saw some respite at the $0.82 support over the past 24 hours.
A breaker block just above an imbalance meant bulls were at a steep disadvantage
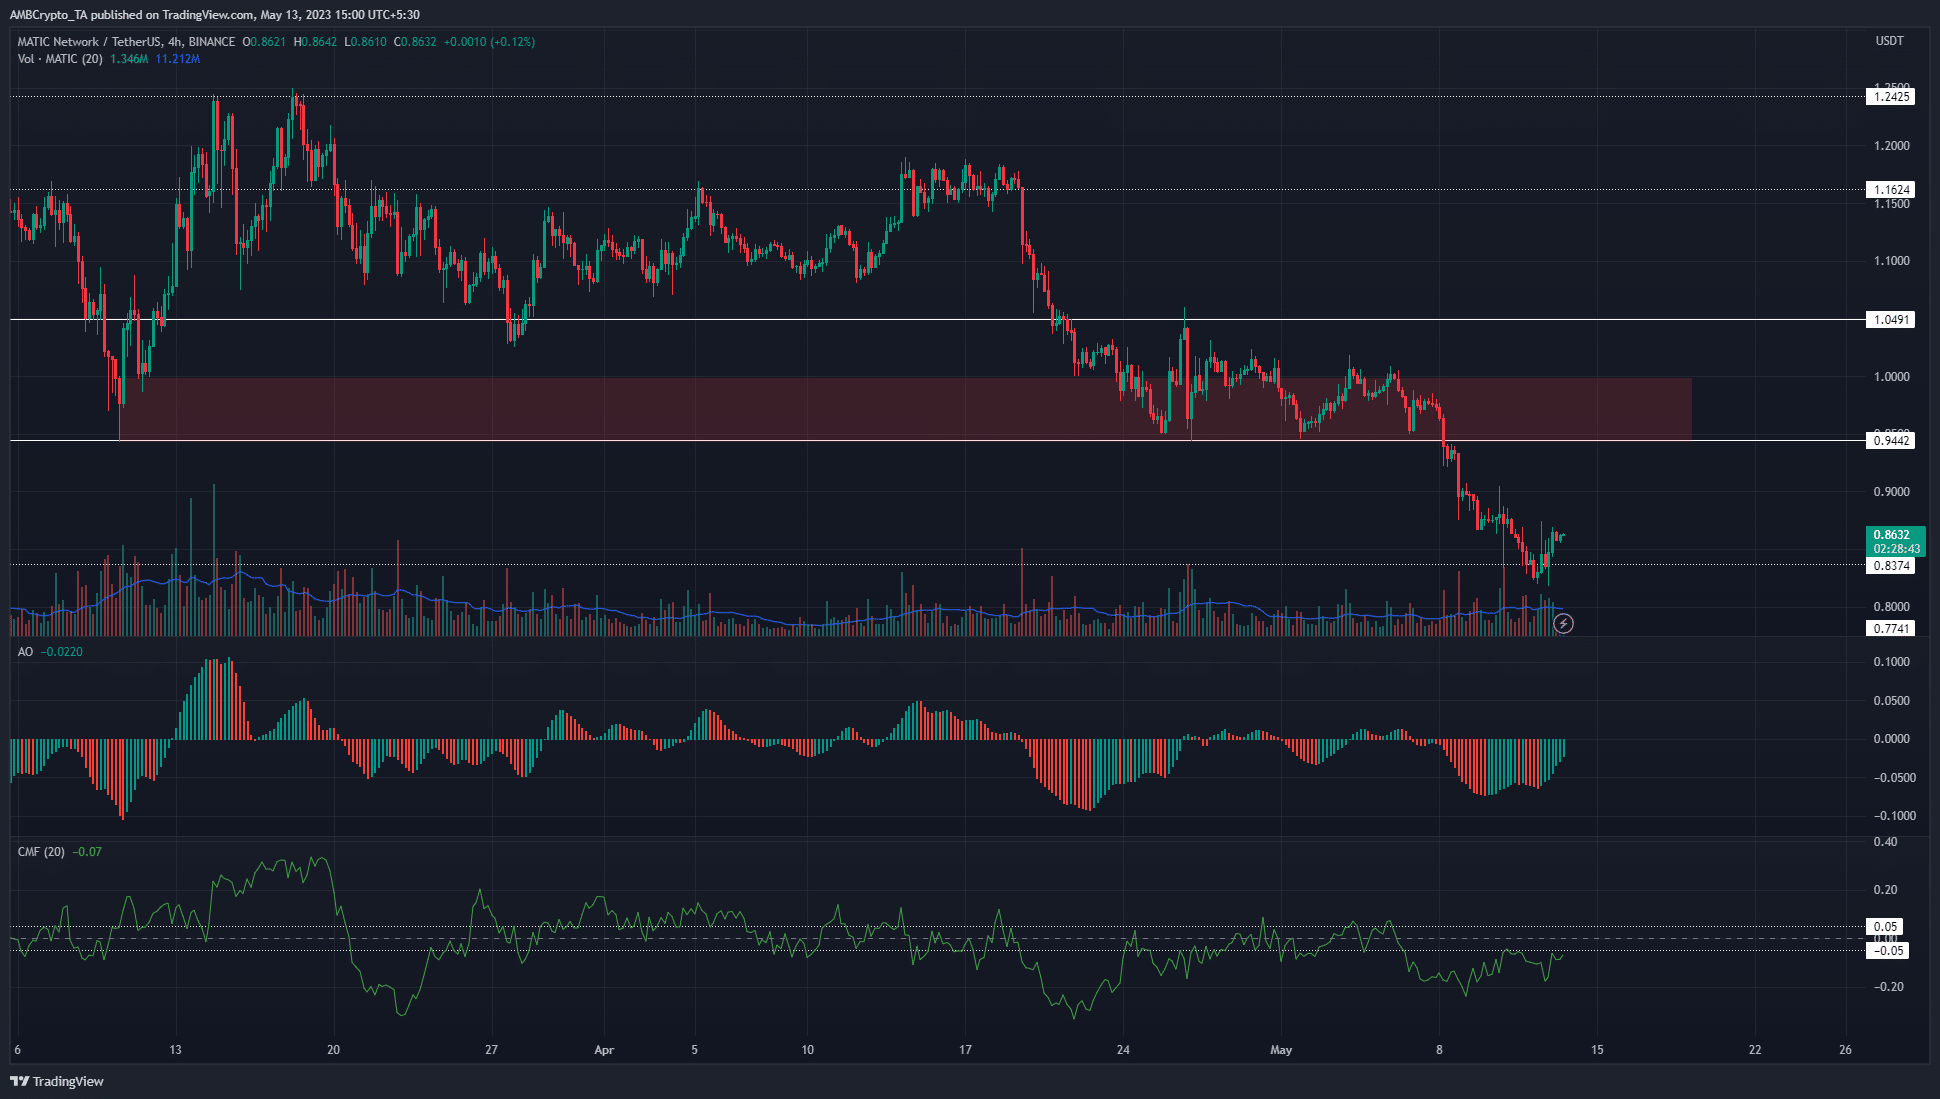
The charts above highlighted the former bullish order block at the $0.94-$1 area in red. This area acted as a support zone in late April, but the bulls eventually succumbed. Hence, the bullish OB was flipped to a bearish breaker.
Moreover, the charts showed the presence of a fairly large imbalance created on 8 May. This FVG stretched from $0.9 to $0.93, and could attract MATIC to it before sending prices lower.
Combined with the breaker block above, it was highly likely that MATIC bulls would be unable to drive prices back above $1 unless the sentiment shifted dramatically.
The Awesome Oscillator showed bearish momentum was weakening, and was a result of the bounce from $0.82. Meanwhile the CMF remained below -0.05 to show strong capital flow out of the market.
Sentiment leaned heavily in bearish favor but began to shift in recent hours
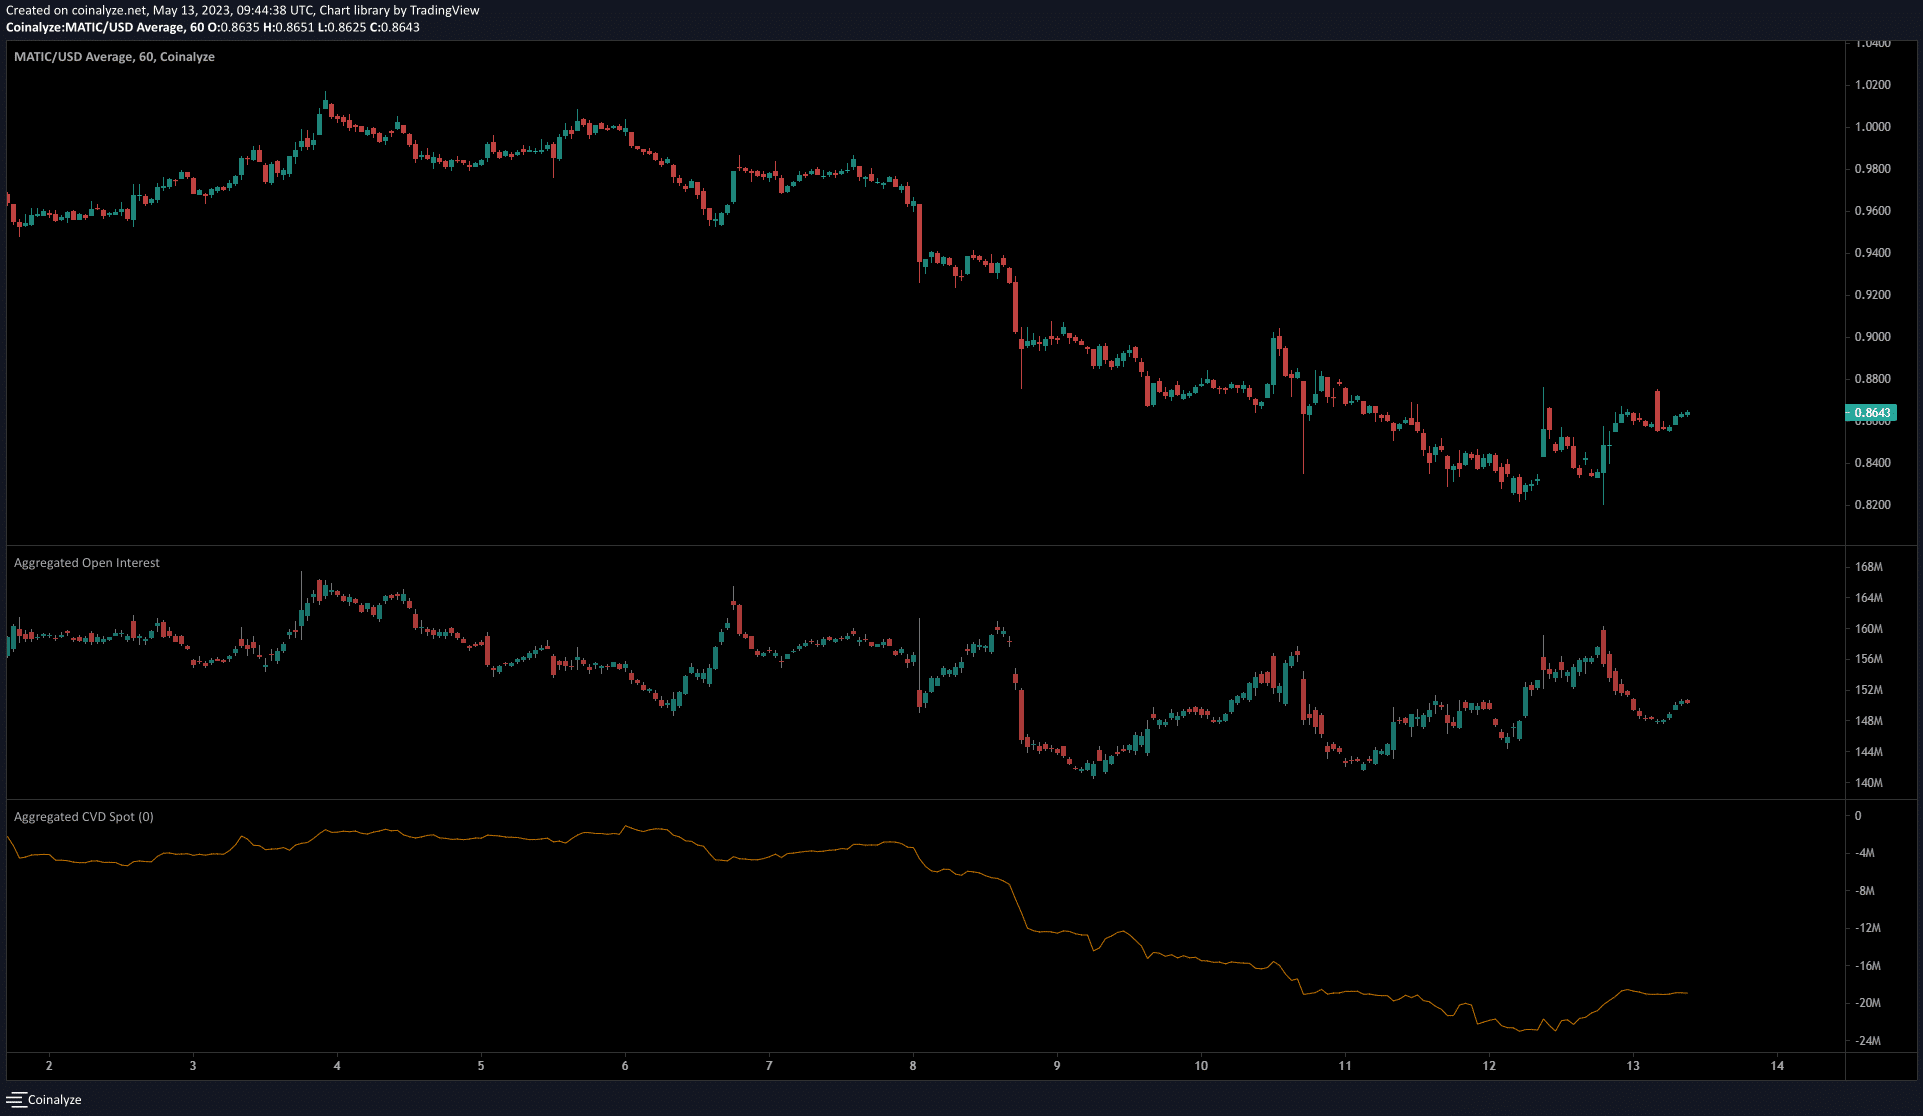
The spot CVD was in a steep downtrend from 8 May to 11 May, but began to reverse on 12 May. This showed an influx of buyers which drove the bounce from $0.82.
The Open Interest rose by close to $10 million on 11 May when MATIC fell from $0.86 to $0.82, which signaled enormous bearish sentiment.
Realistic or not, here’s MATIC’s market cap in BTC’s terms
This has mellowed out over the past 36 hours as the OI showed began to note some bullish speculation.
The OI and prices rose together on 12 May and indicated lower timeframe bullishness. A retest of $0.9 and $0.94 followed by rejection can be utilized by MATIC short sellers.


