


- Polygon has a firmly bullish bias on the higher timeframe price charts.
- Metrics signaled that a retracement was likely.
Polygon [MATIC] witnessed a steady uptrend in recent weeks after the retest of its 100-day range lows at $0.72. The recent push past the $0.9 resistance zone was impressive for multiple reasons.
The first and foremost was the bulls’ renewed attempt to take control of the $1 level. This level has long been a key level, both technically and psychologically. This time, the buyers might have the strength to hold on.
Understanding the order block, imbalance, and the OBV breakout
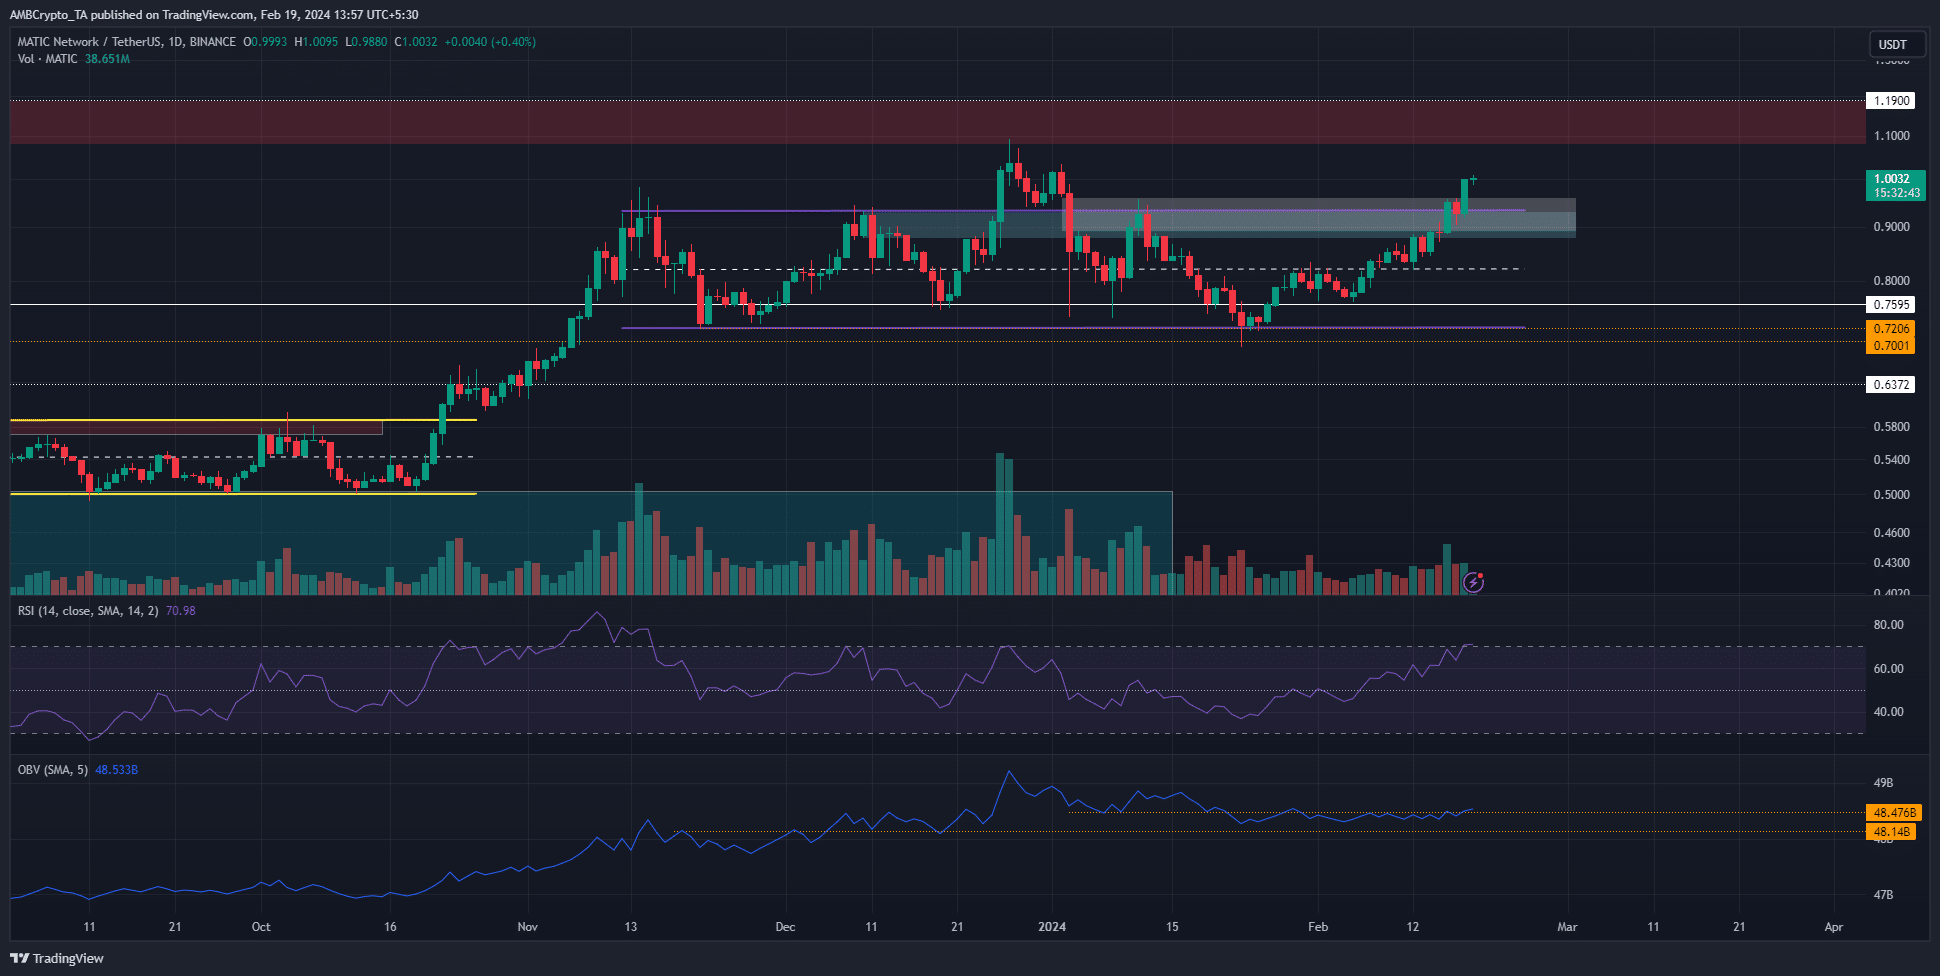
The range (purple) extended from $0.72 to $0.927, with the mid-range mark at $0.821. The bearish breaker block on the one-day chart was highlighted in cyan at the $0.9 zone.
In late December 2023, this order block was breached, and the range highs appeared to be flipped to support.
But on the 3rd of January, MATIC prices dived southward alongside the rest of the crypto market. This left behind a large fair value gap, demarcated by the white box.
This region largely coincided with the bearish order block, marking it as a stiff resistance zone.
On the 11th of January, MATIC rose to this region, but the bulls were rebuffed. The latter half of January saw the token trend downward, but the past three weeks saw the range lows defended.
However, this time, the OBV has managed to break above the key resistance that has plagued the buyers since January. Therefore, a rally to the HTF resistance at $1.19 and beyond was likely.
The previous range formation in October saw a breakout that did not pause or retrace considerably. It was also accompanied by a swiftly rising OBV.
The bulls would be watching the current breakout, hoping for a repeat of the previous one.
The dormant circulation spike is a cause for concern
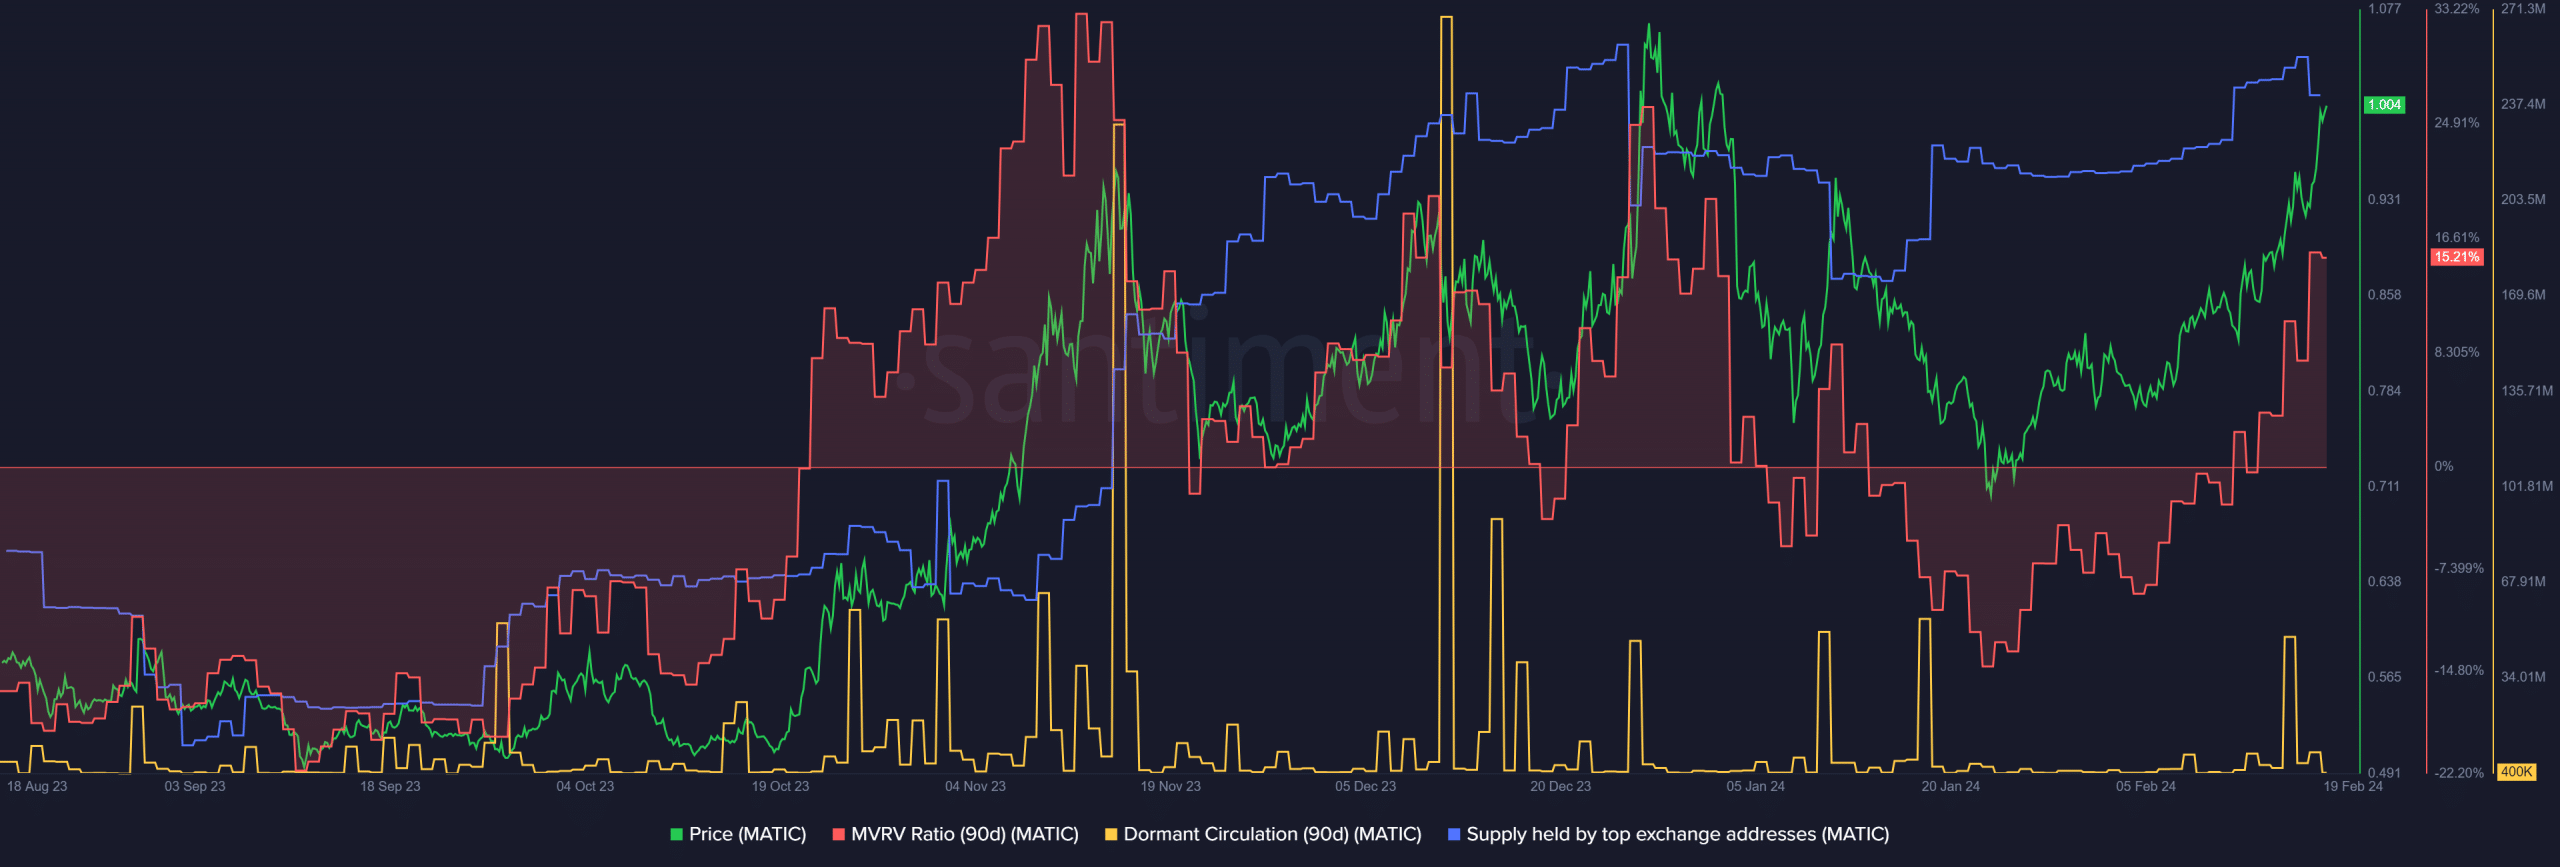
The MVRV ratio has jumped higher due to the price gains and reflected bullish sentiment, as well as holders at a profit. The supply held by exchanges also climbed higher in the past three weeks.
Together, they suggested that selling pressure from profit-taking could arise soon and depress MATIC prices.
More significantly, the dormant circulation saw a notable spike. In the past, it preceded major price dumps. Examples include the metric’s spikes on the 26th of December, and the 10th and 19th of January.
All three were followed by a dump or a continuation of the downtrend for the spike on the 19th of January.
How much are 1, 10, or 100 MATIC worth today?
Not every surge in dormant circulation is guaranteed to be followed by a dump in prices. However, the metrics signal that a short-term price dip was credible.
Hence, bulls could wait for a retest of the $0.9-$1 region to re-enter long positions.
Disclaimer: The information presented does not constitute financial, investment, trading, or other types of advice and is solely the writer’s opinion.