MATIC bulls have hopes of a bounce in next week, here is why

Disclaimer: The findings of the following analysis are the sole opinions of the writer and should not be considered investment advice.
Polygon plans to incorporate a massive boost to transaction speeds and reduce fees. In a recent blog post the team revealed their experimental results from using different block sizes.
Can these improvements in the pipeline have a positive effect on the price? The price charts showed the MATIC bears to have the upper hand over the past week, but the buyers could force a bounce toward $1 in the coming weeks.
MATIC- 1-Day Chart
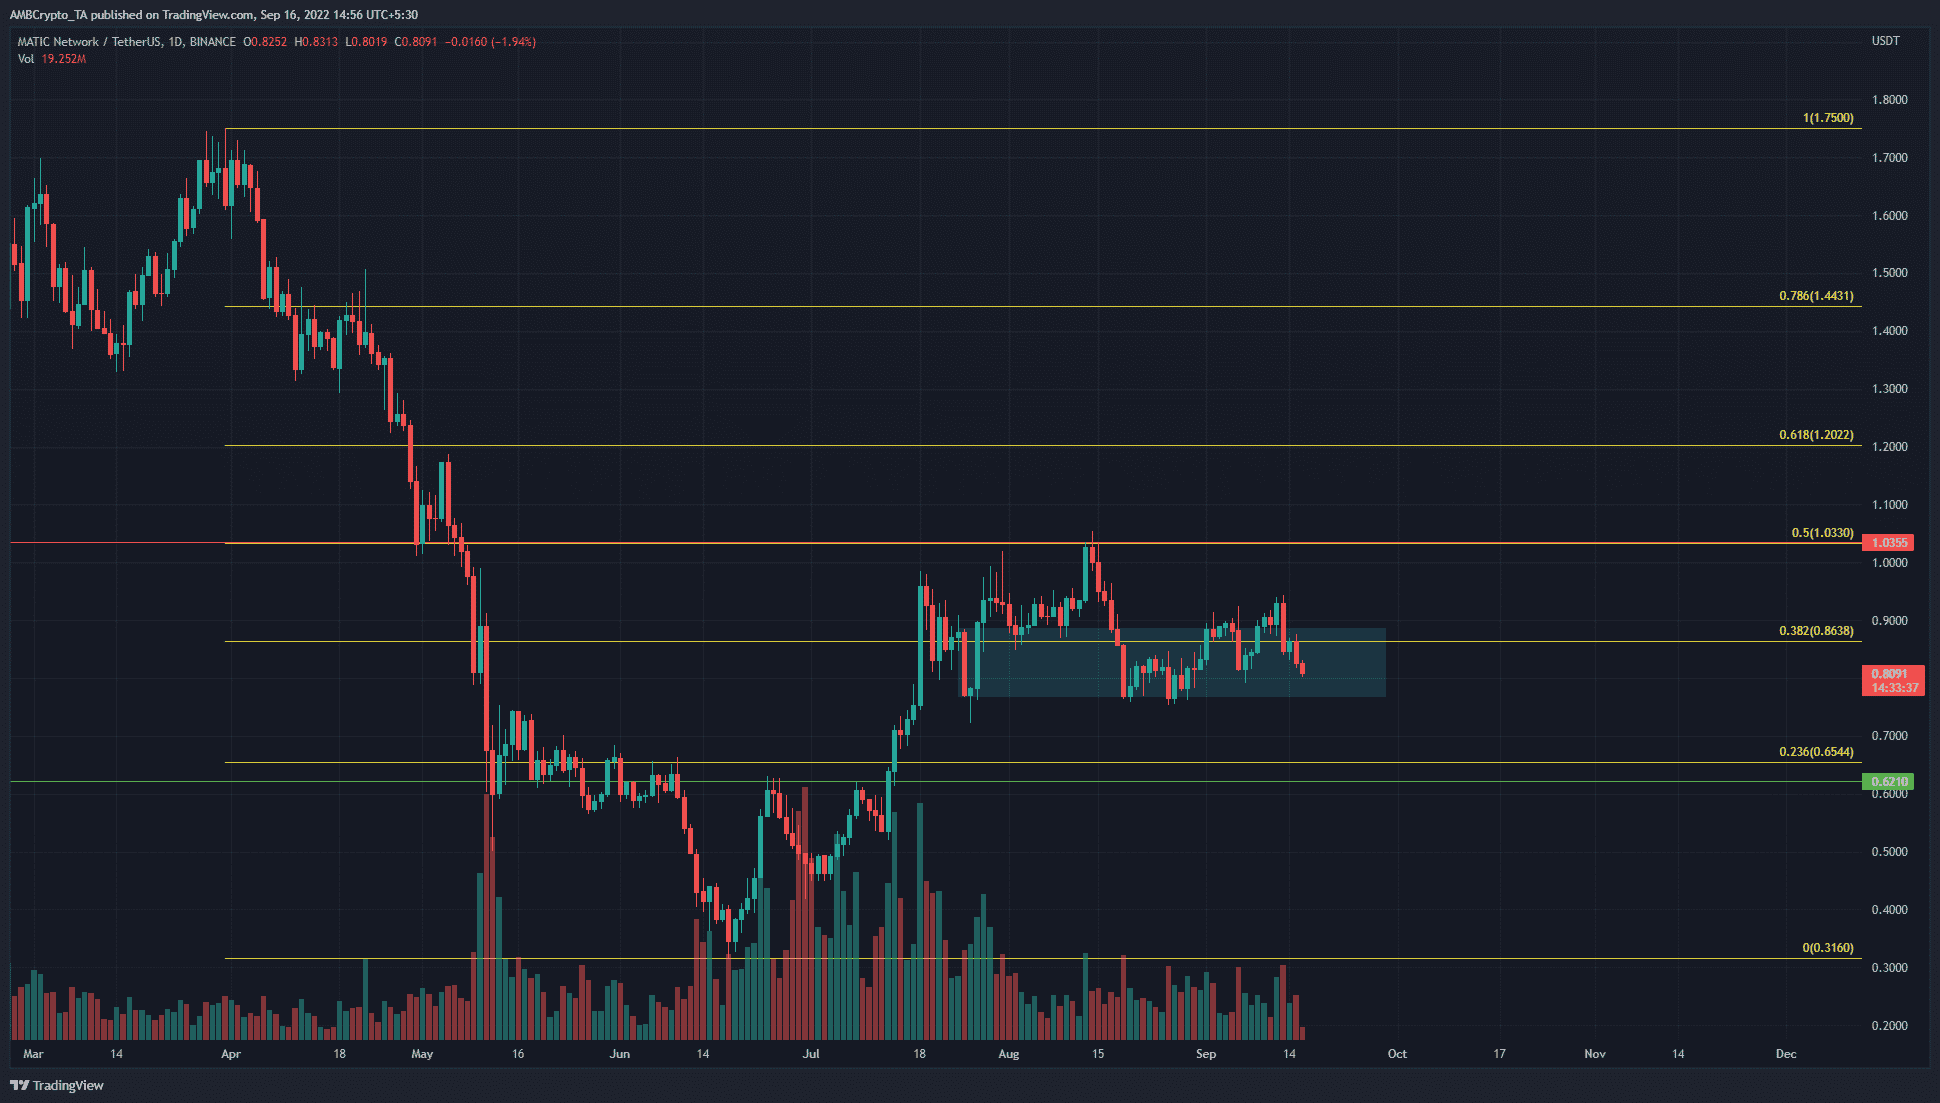
A bullish order block was seen in the $0.8 region (marked in cyan). It shows a bearish candle followed by a bullish move higher to $0.9 and $1.03. The dip followed by a break in structure to bullish meant that the $0.88-$0.76 is a strong zone of support for MATIC.
At the time of writing, the token was trading at $0.809 and could dip further as well. The momentum has been slightly bullish in recent weeks, but the long-term trend was not bullish.
Since mid-July, the price has traded between $0.75 and $1. The Fibonacci levels (yellow) plotted showed $1.03 and $0.86 to be important levels to watch out for.
Could this change in the weeks to come? If Bitcoin sees a sharp plummet once more, then it was very likely that MATIC could follow and break beneath $0.76. Until the token does indeed break down below, it offered a buying opportunity.
Rationale
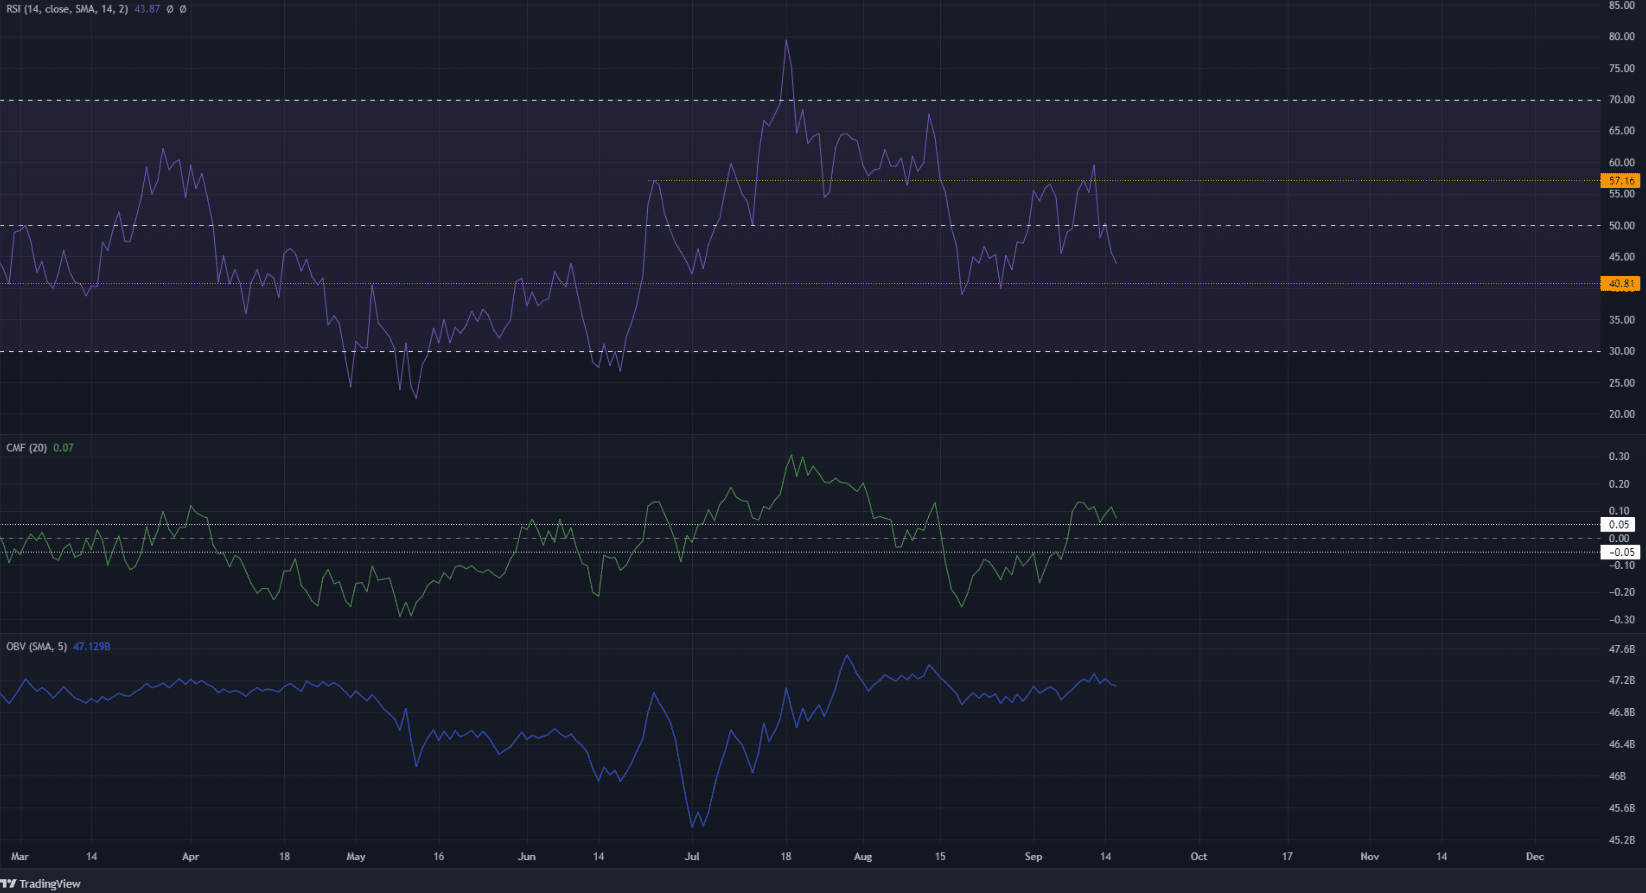
The RSI dipped below neutral 50 and retested the same as resistance. In recent months, the 57 and 40 levels have acted as support and resistance. This was not surprising, as the vicinity of 40 and 60 usually do.
The inference from the RSI was that momentum favored the bears, but the overall picture was not bearish yet. That would require a drop below the 40 mark. The most recent time the RSI was below 40 was back in June.
The CMF and the OBV showed some buying pressure in September. The OBV crept upward slightly, while the CMF was able to climb past +0.05 to outline significant capital flow into the market.
The OBV has been in an uptrend since July but in the past month, it has only moved sideways. Therefore, buying and selling pressure have balanced each other.
Conclusion
Neither the bulls nor the bears had a strong grip on the markets at the time of writing.
The skirmish was concentrated within the $1.03 and $0.76 levels.
Over the next few days, the test of the $0.8 support zone could be followed by a surge back above $0.86. This would likely see MATIC reach higher toward $1.03, with some resistance at $0.94 as well.


