MATIC buyers in the $1.57 area can manage their positions if…

Disclaimer: The findings of the following analysis are the sole opinions of the writer and should not be considered investment advice
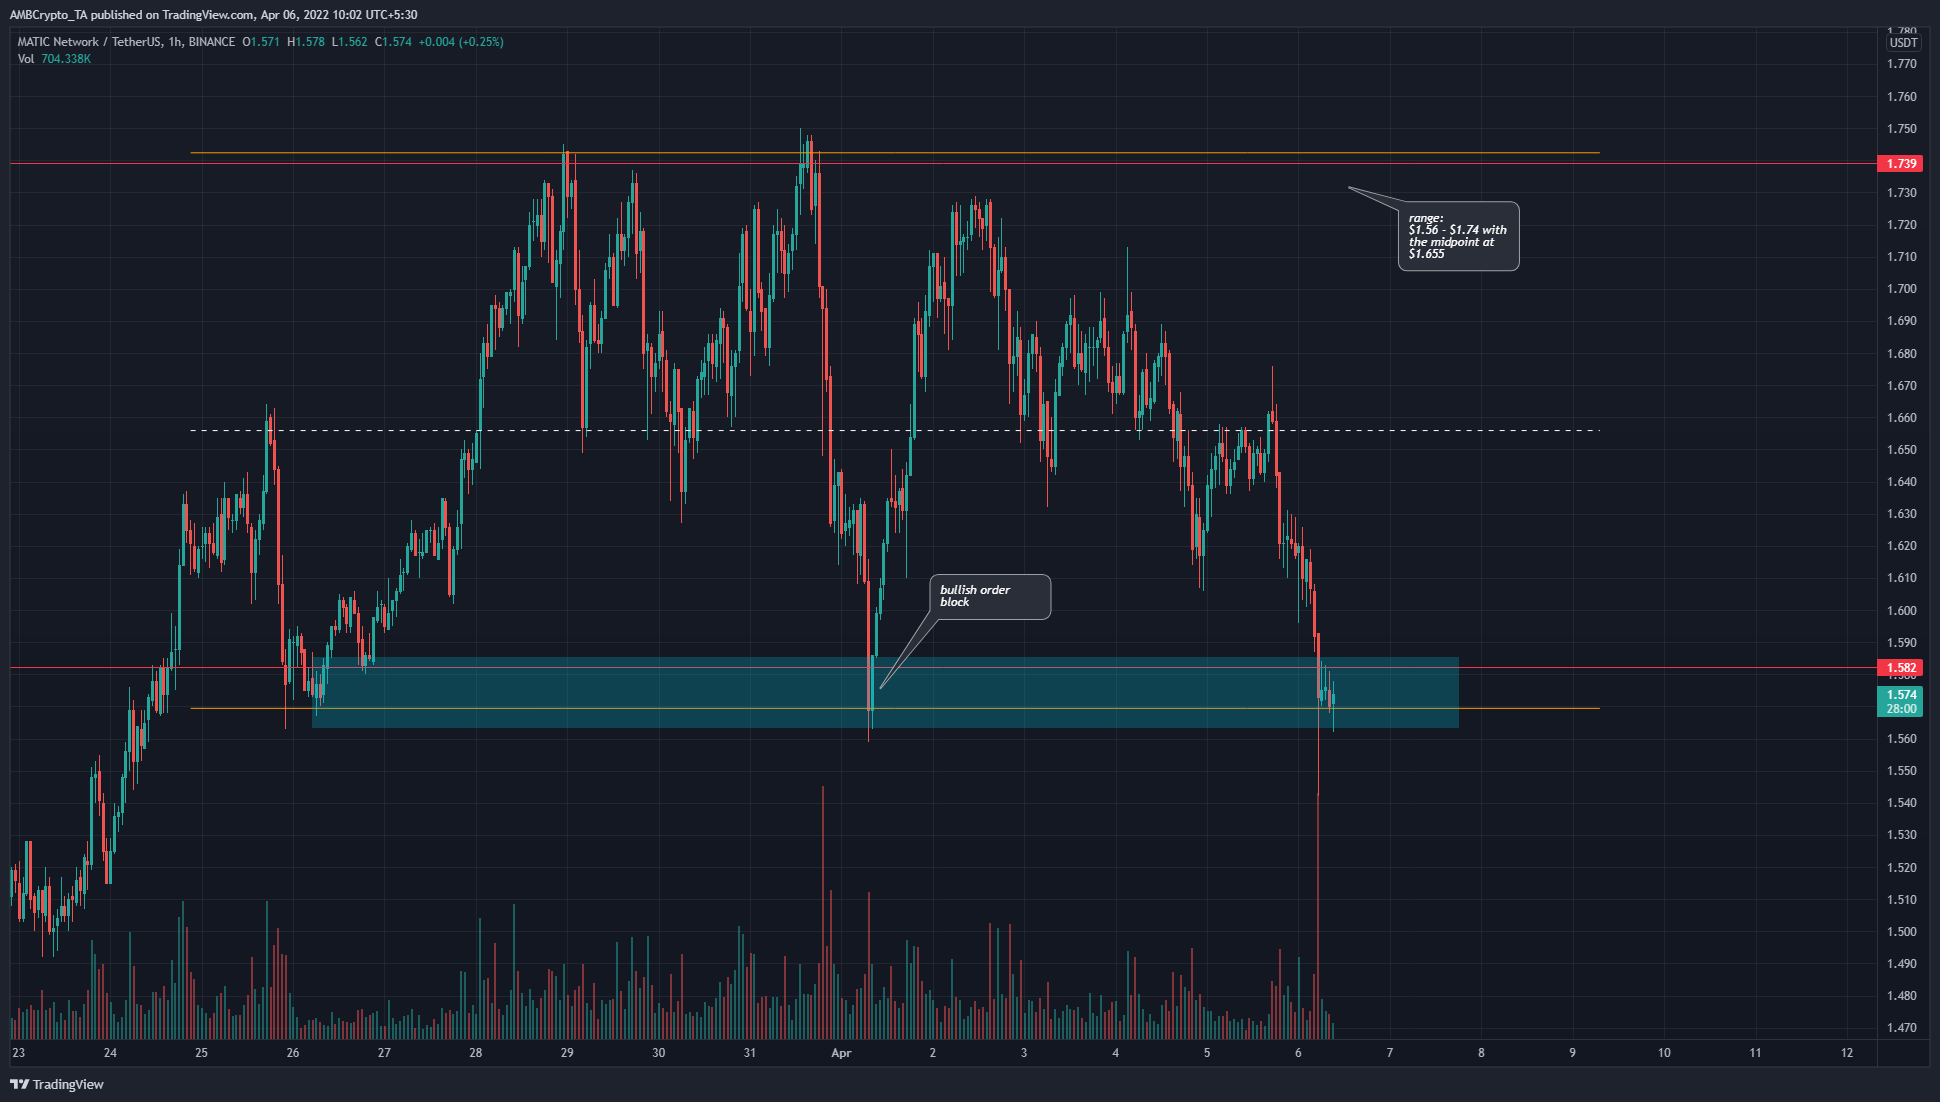
MATIC was trading at the lows of a short-term range that the price has traded within for nearly two weeks. The range lows also have the presence of a bullish order block. This meant that buyers are likely to be interested in the asset in the short term once again. Buying pressure could drive prices toward range highs of $1.74.
MATIC- 1H
In early April, the price visited the range (orange) lows at $1.56 and saw an immediate, impulsive move upwards. This saw the formation of a bullish order block. It represents an area where buyers are likely to be interested, and if MATIC can climb back above $1.58 resistance, it would be more likely that MATIC would see a leg upward.
There is also confluence with the range lows, marking this area (cyan box) as important in the next few hours.
The $1.58, $1.61, and $1.65 levels could present some resistance to the price, and buyers in the $1.57 area can look to manage their positions if MATIC does manage to climb to the mid-range point.
Rationale
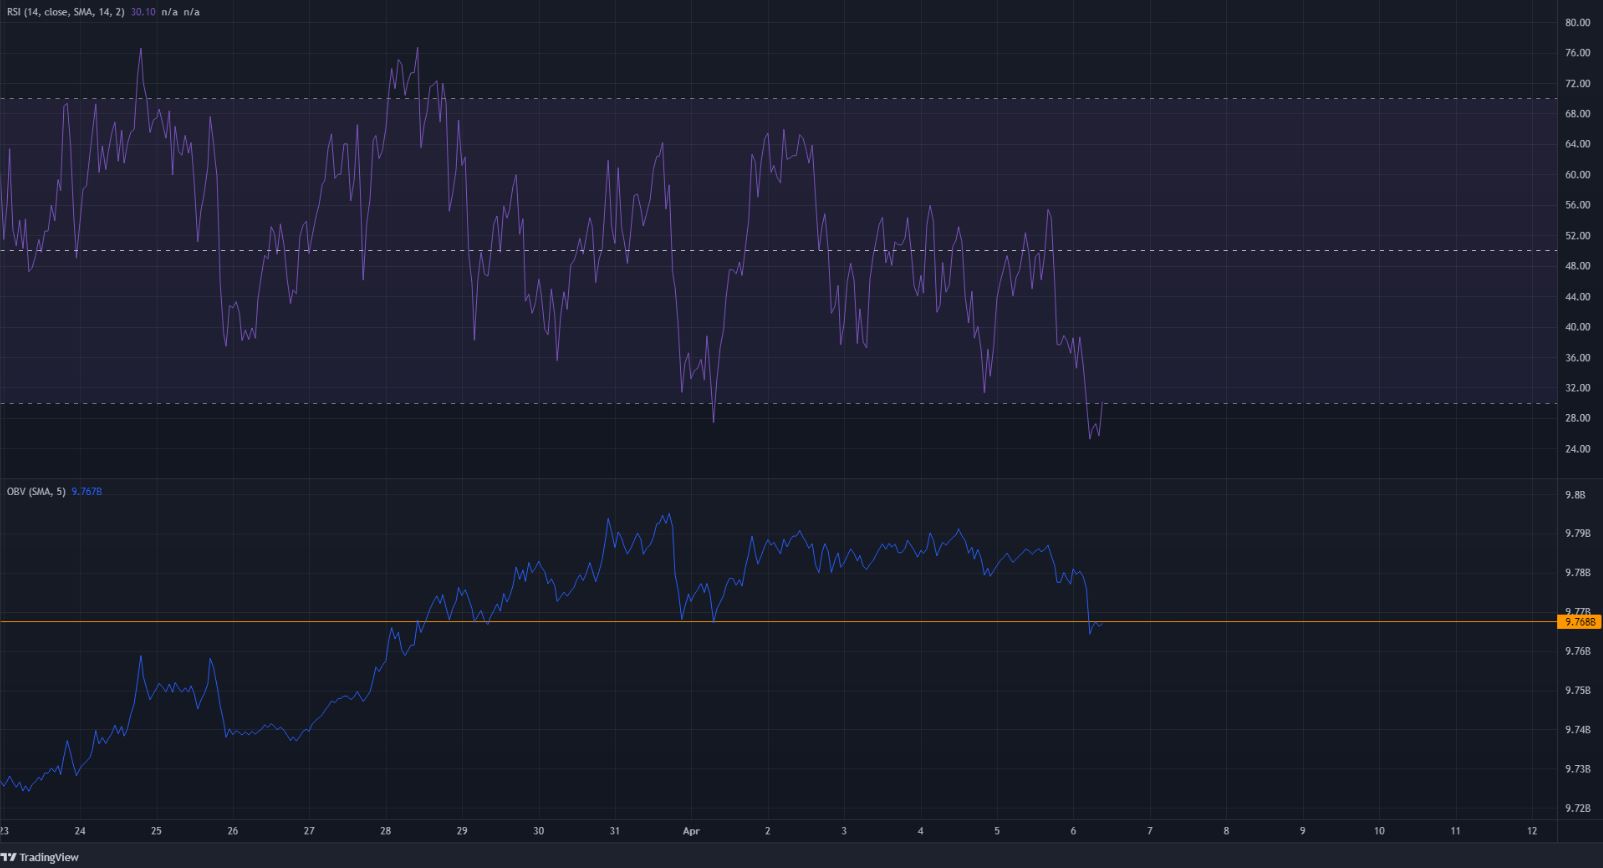
The RSI was just above the oversold territory and had a value of 30.1 at press time. By itself, an oversold RSI is not indicative of a bounce. However, confluence with a bullish order block and range lows means there is a high reward, a low-risk buying opportunity.
The OBV has fallen a bit in the past couple of days and was beneath a level of near-term importance. If the OBV can pull itself back above the orange line, it could mean that bulls are vying for market control once more.
Conclusion
While the indicators showed bearish momentum and selling pressure had been strong in recent hours, there was a good likelihood that MATIC can see a bounce toward $1.65 in the next few hours. Bitcoin was also trading just above a demand zone and could see a bounce, which would likely influence MATIC positively.


