MATIC has been stagnant on the charts but bulls can watch for this region
MATIC has traded sideways in the market in April, and did not possess any strong trend on the lower time frames. The volatility of the CPI announcement could drag MATIC downward, but a retest of a bullish order block could see demand for the token and present traders with an opportunity.

Disclaimer: The information presented does not constitute financial, investment, trading or other types of advice and is solely the writer’s opinion.
Bitcoin Dominance has been trending higher since September, but the total crypto market cap was limited to beneath the $1.2 trillion mark. At the time of writing, this level appeared to be on the verge of being broken.
This was good news for crypto enthusiasts, investors and traders, as it showed capital inflow into the market. Bitcoin’s rally in Q1 2023 could carry over into Q2, and this would likely be good news for MATIC as well.
Read Polygon’s [MATIC] Price Prediction 2023-24
The bullish and bearish order blocks to watch out for
Despite the bullish momentum across the market, especially Bitcoin and Ethereum, over the past week, many altcoins did not post a rally. Instead, they noted some gains which were quickly wiped out.
Alongside the rising BTC Dominance the interpretation was that sentiment was not strongly bullish yet behind altcoins. Yet, the signs showed MATIC could see a breakout in the coming weeks.
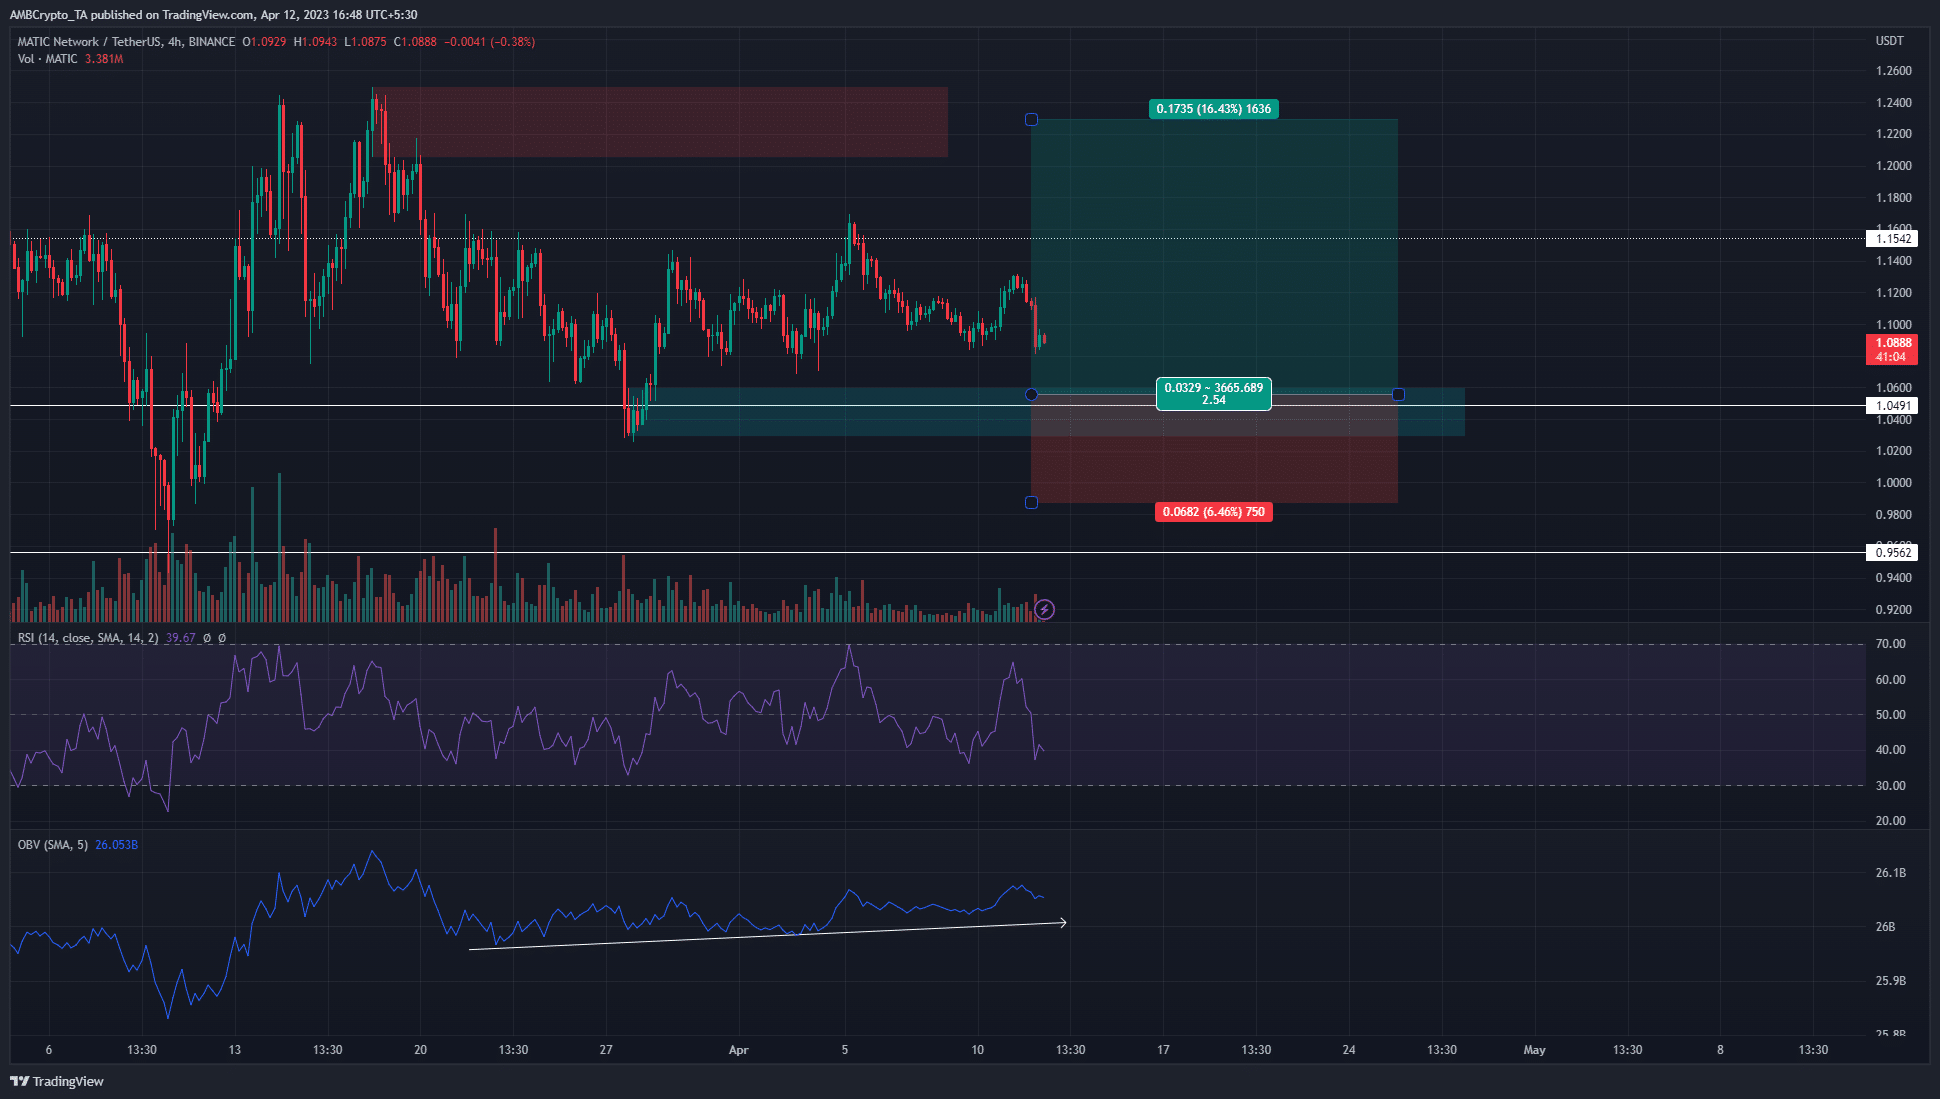
Furthermore, the OBV has been in an uptrend over the past month, although the RSI denoted severe downward momentum. A look at the market structure on the 4-hour chart showed indecisiveness and near-term bearishness.
How much are 1, 10, or 100 MATIC worth today?
The daily structure was bearish, and a move down to the H4 bullish order block at $1.05 was possible. In this scenario, given the OBV’s uptrend, bulls can look to buy Polygon’s tokens in an attempt to ride a positive reaction.
The strong bearish sentiment of last week has subsided
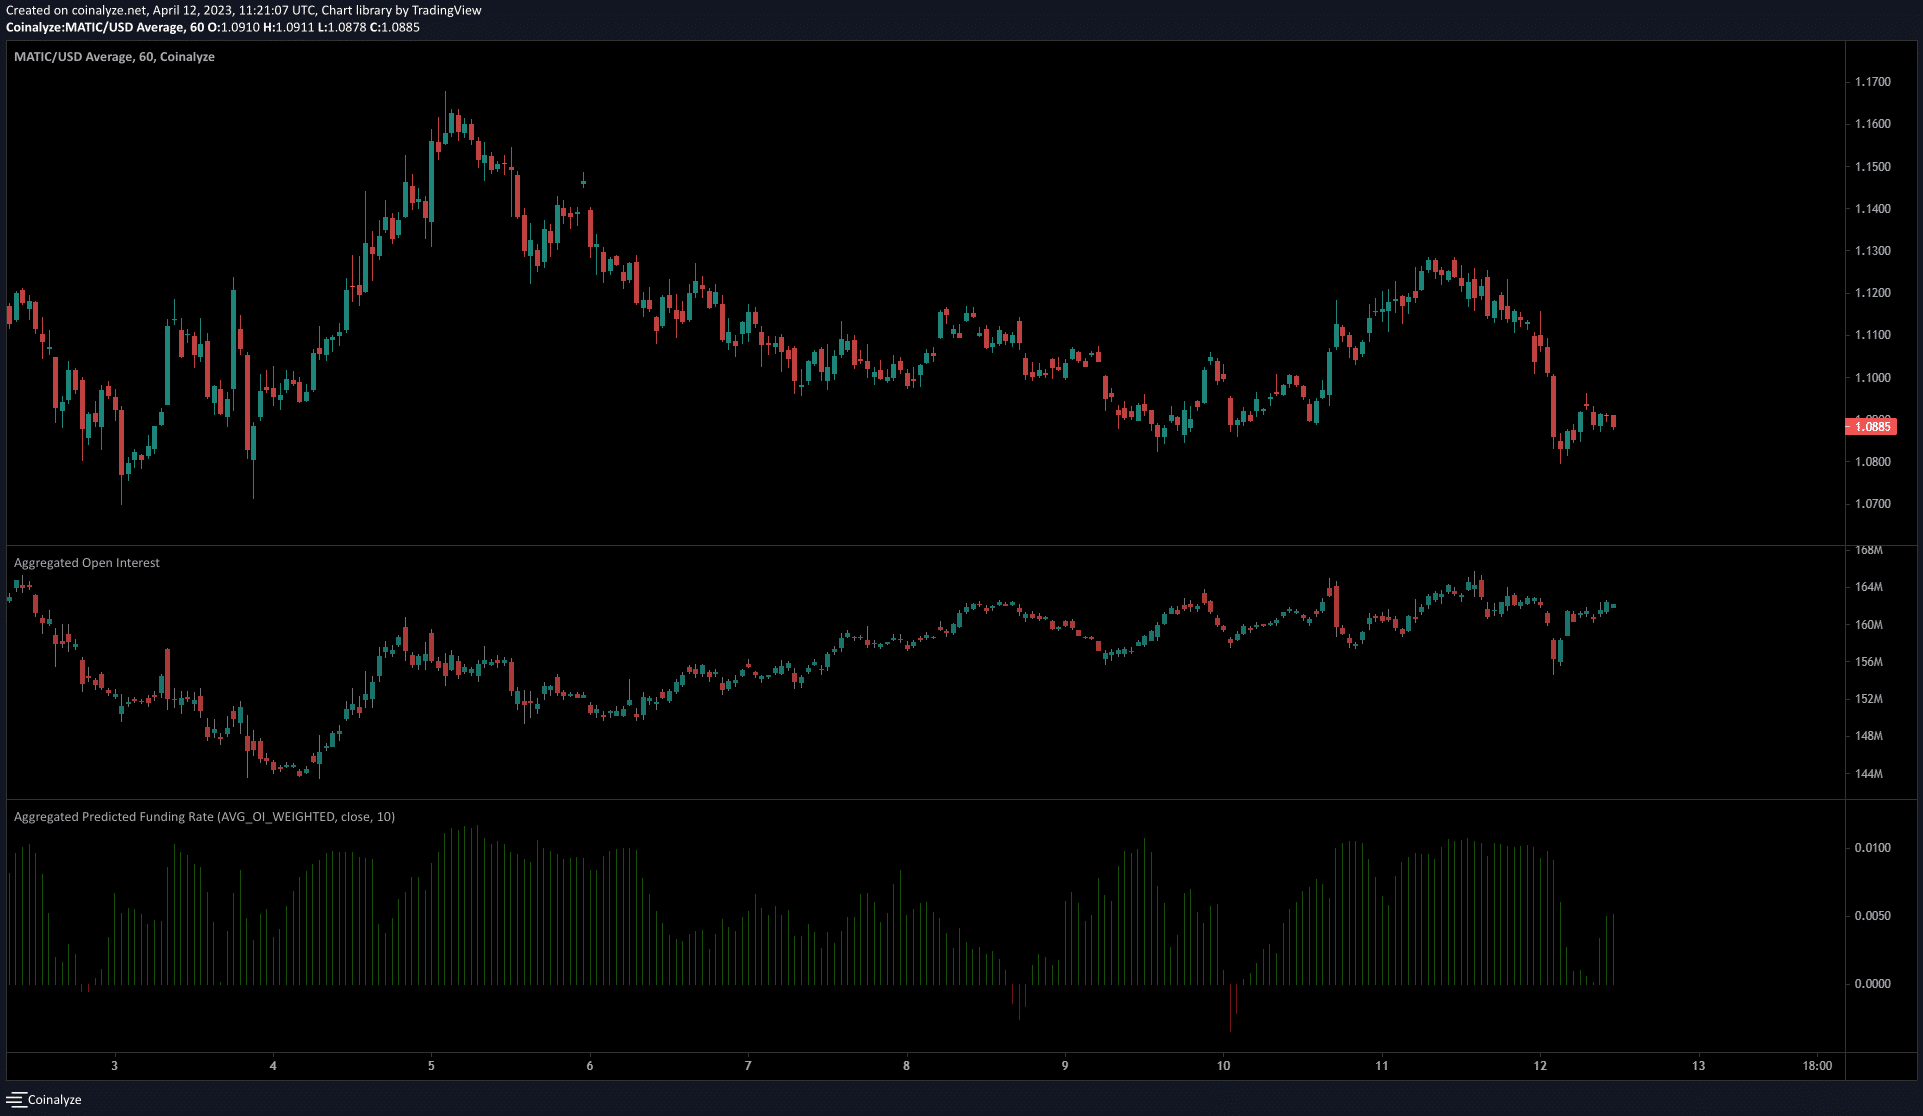
From 5 April to 8 April, the price of MATIC was in decline, but the Open Interest was rising higher, which was a sign that speculators were shorting the asset. Additionally, the 1-hour chart from Coinalyze highlighted that this sentiment has waned, and participants were more neutral in the past couple of days.
The funding rate was positive, but saw a sharp decline over the past 24 hours. It was possible that it could slip below zero and highlight bearishness in the market. As things stand, sentiment was not yet in favor of the bears.