
- MATIC retained its long-term bullish outlook
- The liquidation levels highlighted a key support level should the $1 support be breached.
Polygon [MATIC] was below its higher timeframe support zone after achieving a breakout earlier this month. This does not indicate bearishness, but the next few days could bring more volatility.
The higher timeframe uptrend was still intact, which meant that investors could seek to use any dips as a buying opportunity.
The momentum divergence that started in February
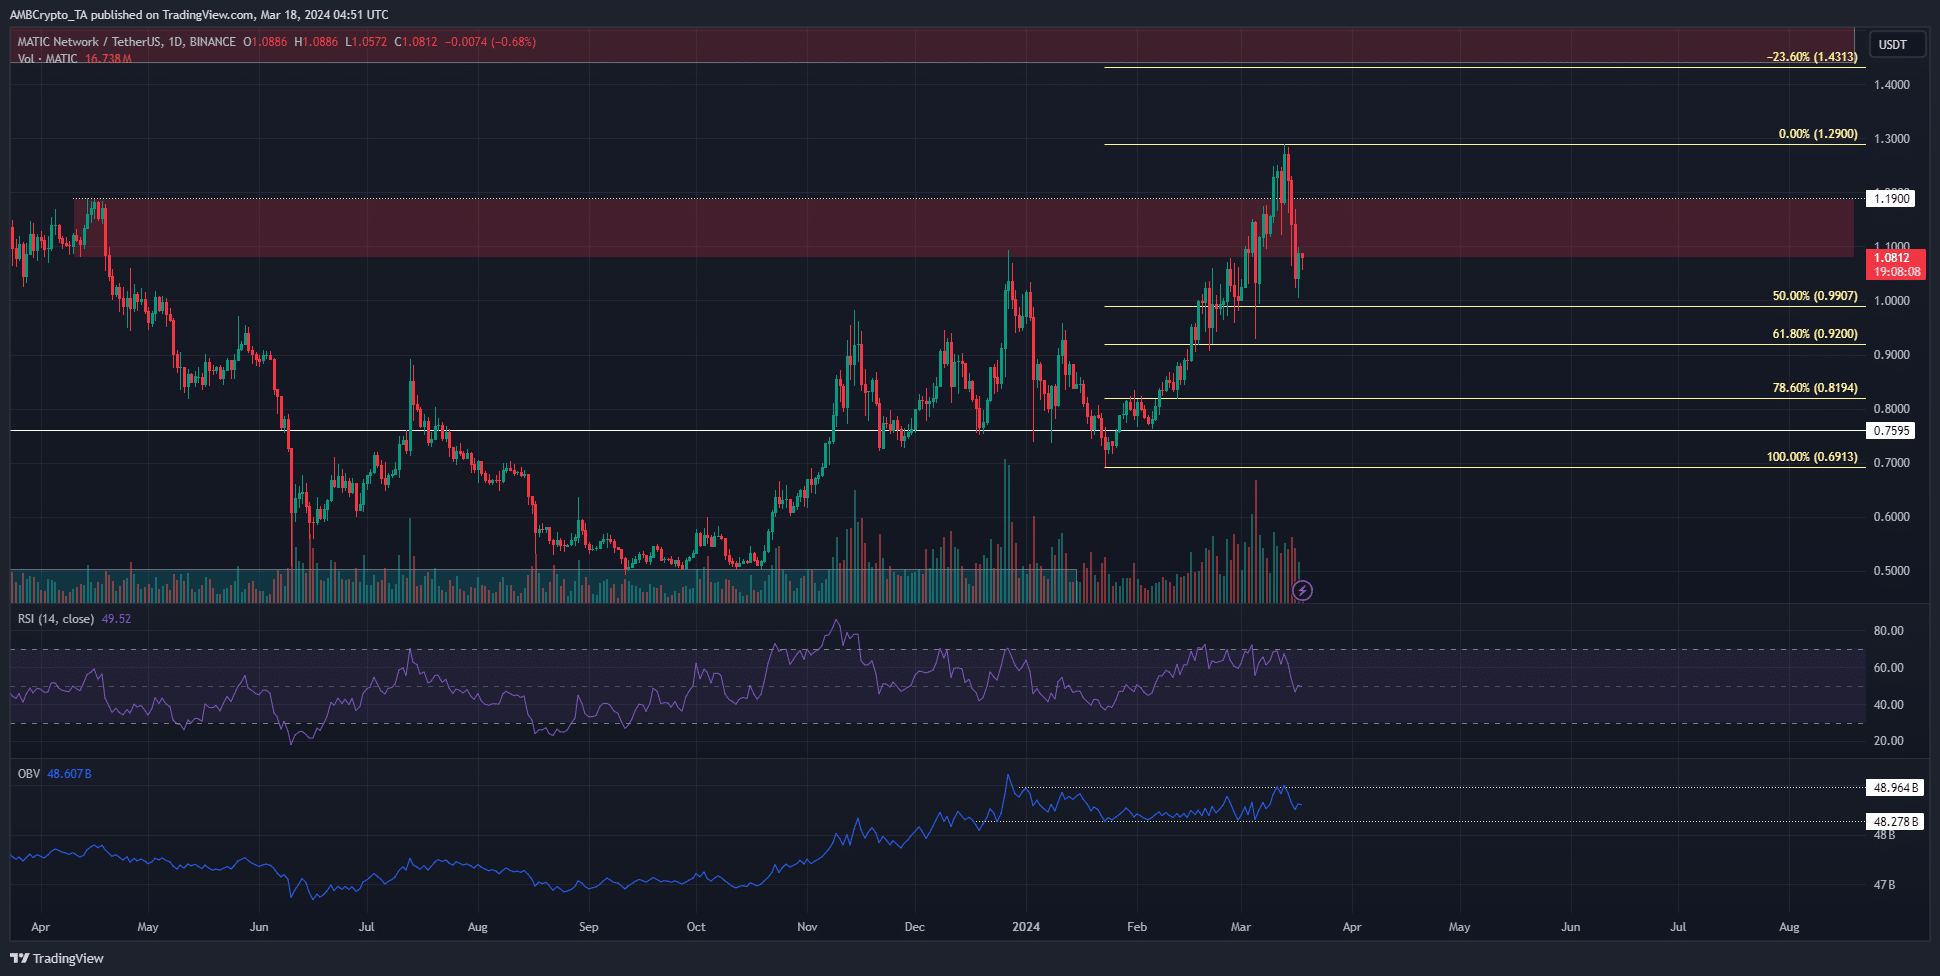
Source: MATIC/USDT on TradingView
MATIC has a bullish market structure on the 1-day chart, but its momentum has taken a hit. The RSI was at 49.5 and indicated that the momentum to the downside was building.
Additionally, the $1.09-$1.18 support zone was not defended.
This region was highlighted in red because it was a bearish order block on the weekly chart. MATIC’s recent ascent to $1.29 suggested bulls would flip this region from resistance to support.
However, the buyers were unable to do so.
The Fibonacci retracement levels showed that the $0.819-$0.92 region would likely be tested as support in the coming days or weeks.
This would likely present a buying opportunity, given the bullish D1 market structure.
The OBV moved within a range since late December, despite the strong rally of MATIC during this time. This highlighted the relative lack of buying during the past two months’ uptrend.
The heatmap signaled a move below $1 was imminent
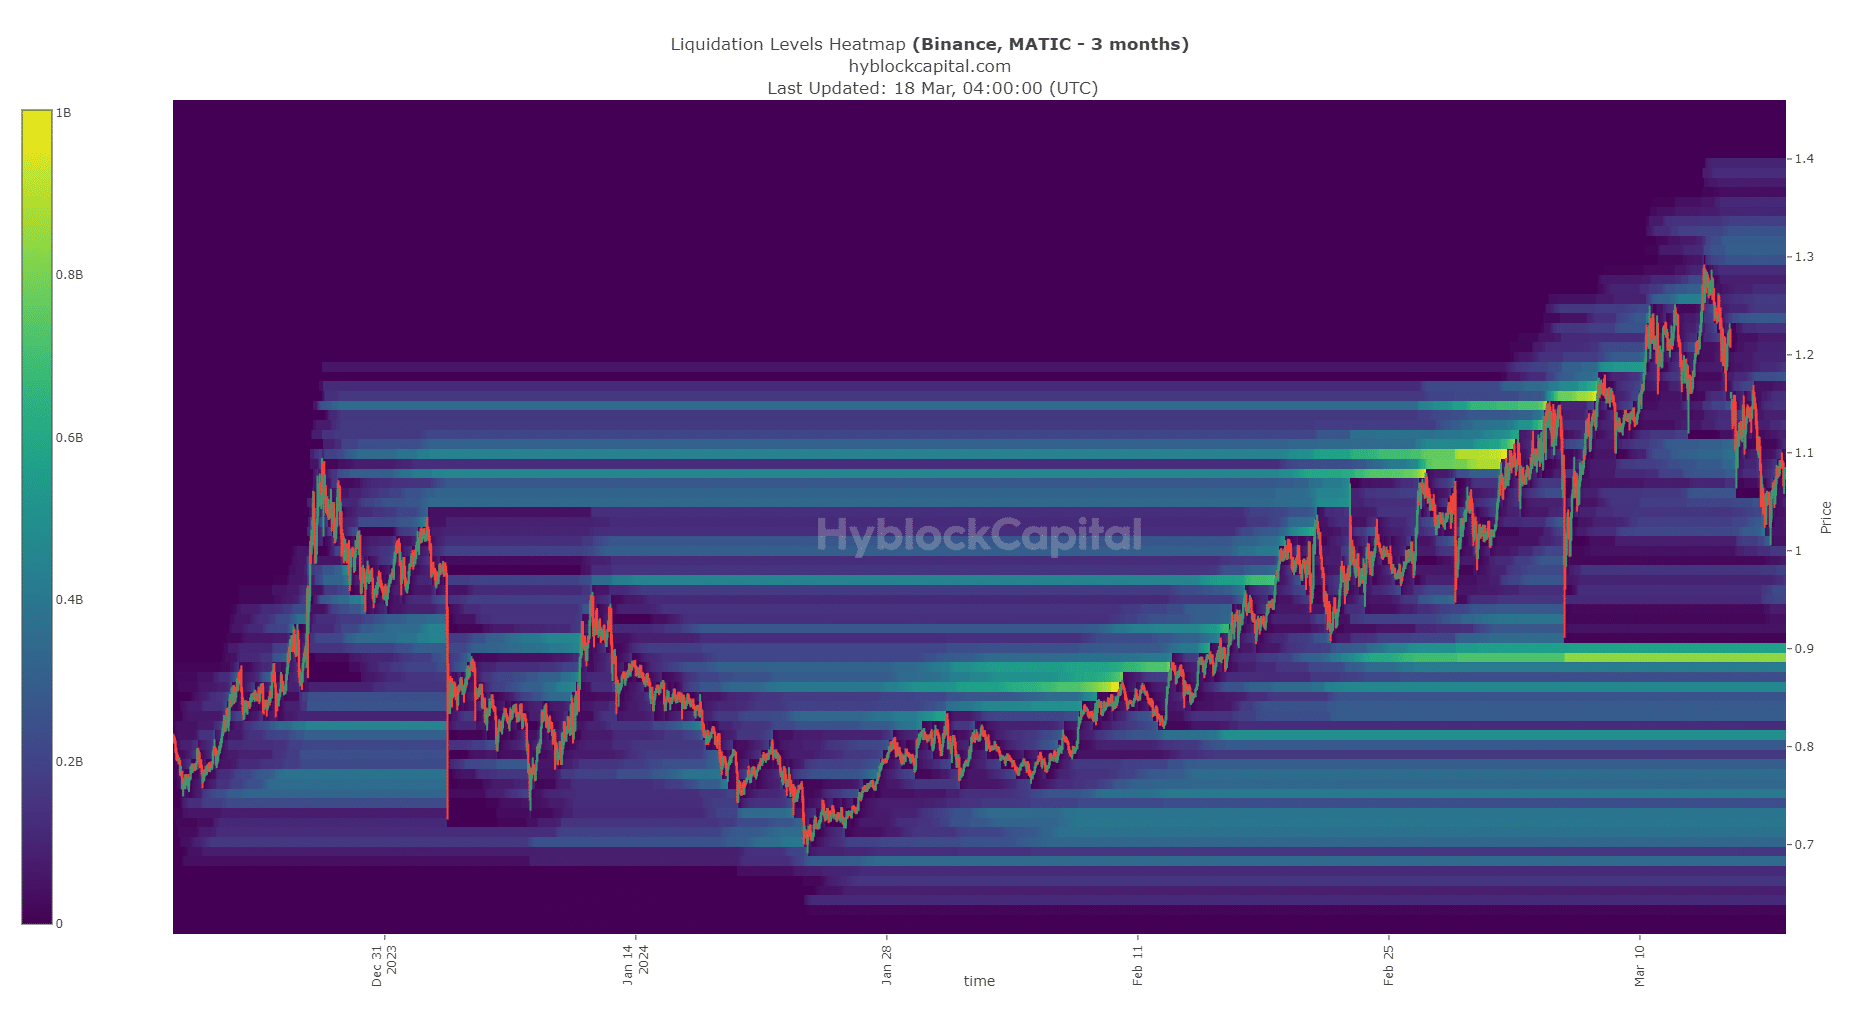
Source: HyblockCapital
The liquidation levels heatmap of the past three months did not reflect significant pockets of liquidity near $1.1. To the north, the $1.3 region was a target. However, at the $0.89 level was an extremely bright band.
How much are 1,10,100 MATICs worth today?
This underlined a huge number of liquidation levels were present there and would likely attract MATIC prices to them. It also has confluence with the support zone from the Fibonacci retracement levels.
Therefore, AMBCrypto anticipates a move to the $0.9 level, especially if Bitcoin [BTC] sinks below $67k.
Disclaimer: The information presented does not constitute financial, investment, trading, or other types of advice and is solely the writer’s opinion.


