MATIC in short-term range- Potential take-profit levels and stop losses should be…

Disclaimer: The findings of the following analysis are the sole opinions of the writer and should not be considered investment advice
Bitcoin has been trading within a range from $28.7k to $30.7k, and the lowered volatility on Bitcoin saw much of the rest of the altcoin market form a range, or descend lower on their price charts.
MATIC was one of the coins that formed a range in the past ten days, however, the mid-point of the range alongside a longer-term horizontal resistance level has rebuffed the bulls over the past few days.
MATIC- 1 Hour Chart
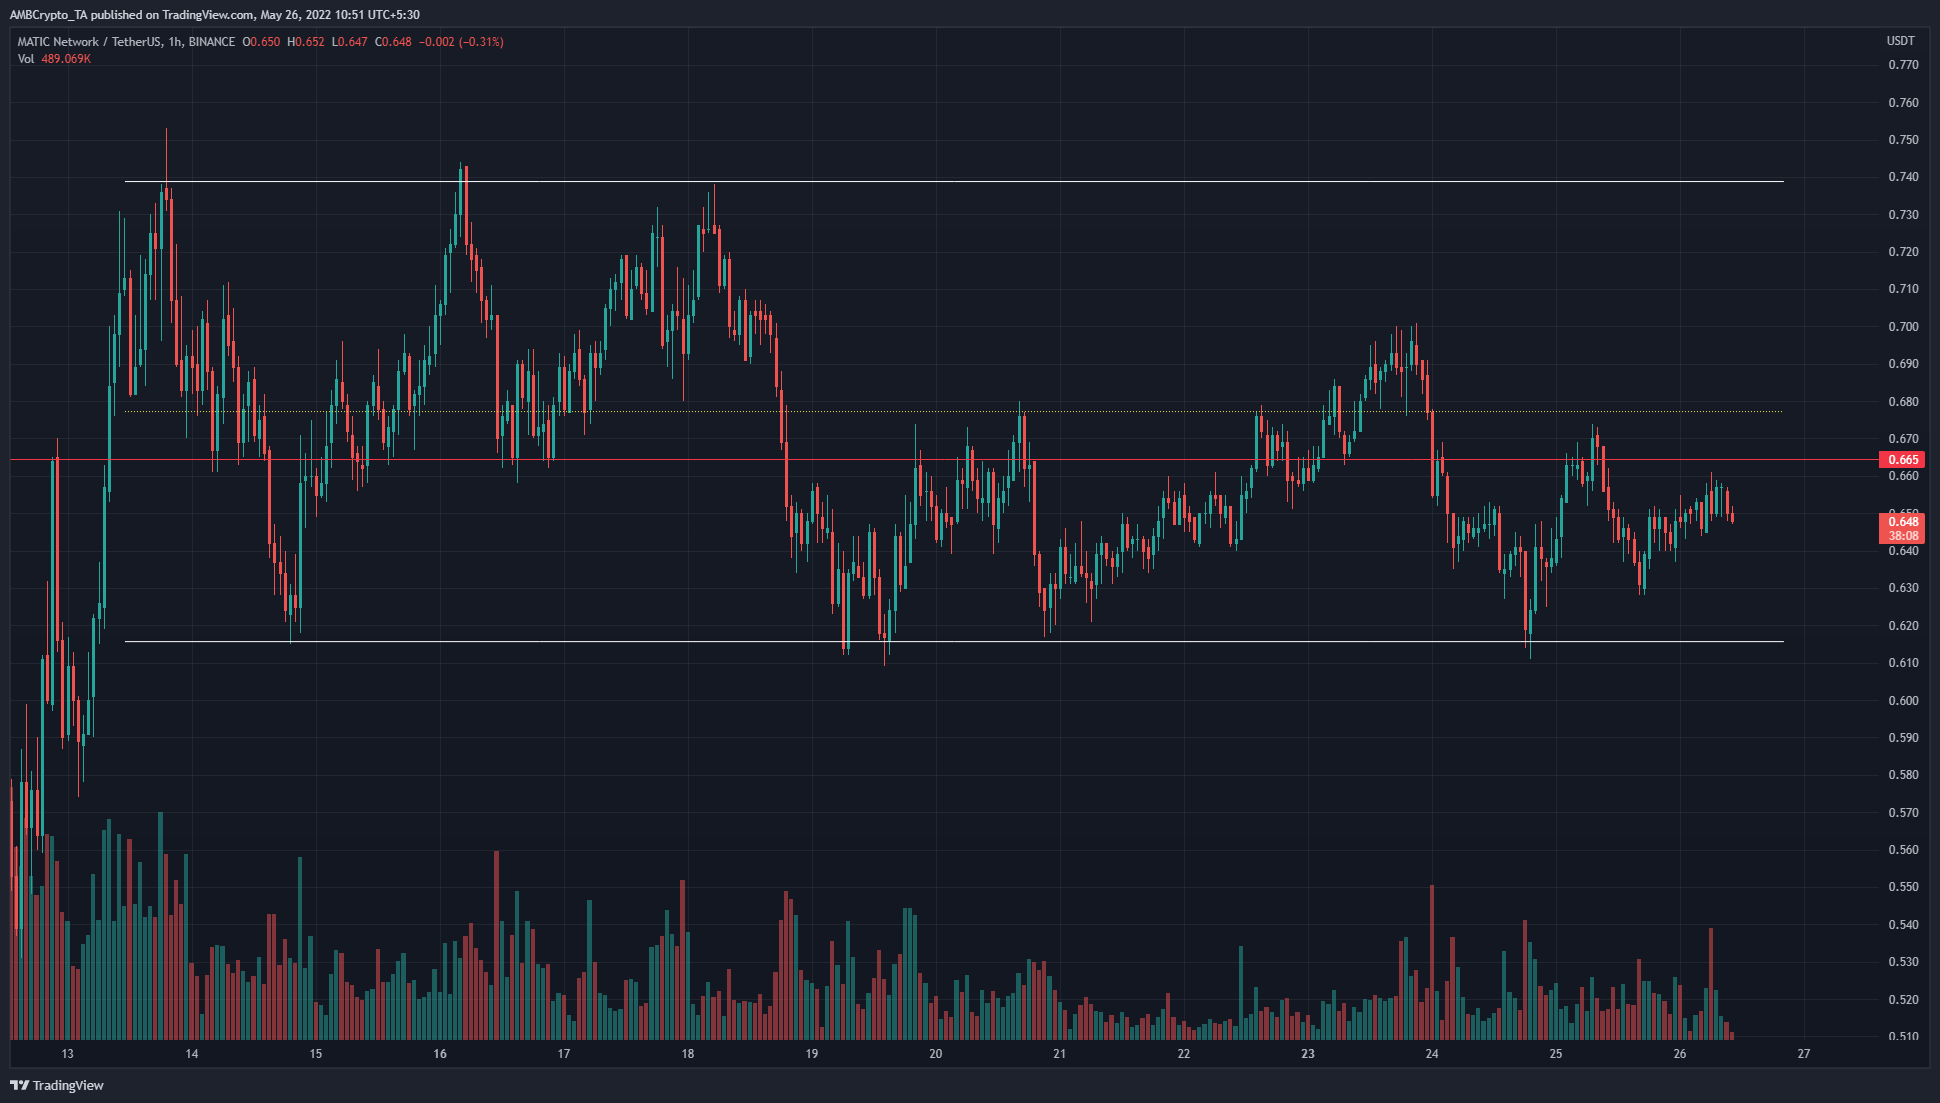
In the past two weeks, the price has ranged from $0.616 to $0.739. There have been session closes or candle wicks that have extended beyond these two levels of support and resistance. The mid-point of the range lay at $0.677 and has acted as support and resistance to MATIC in the same time period.
The trading volume has been more or less steady for the time period MATIC has traded within this range, however, the previous weekend saw reduced trading volume. Alongside the mid-point of the range, the $0.665 resistance level has also been important in the past two weeks.
Therefore, a move to the $0.61-$0.62 area can be used to buy the coin, with a stop-loss at $0.6 for aggressive traders, or $0.575 for traders willing to give themselves more margin for error. Potential take-profit levels are $0.665, $0.677, $0.7, and the range highs at $0.74.
Rationale
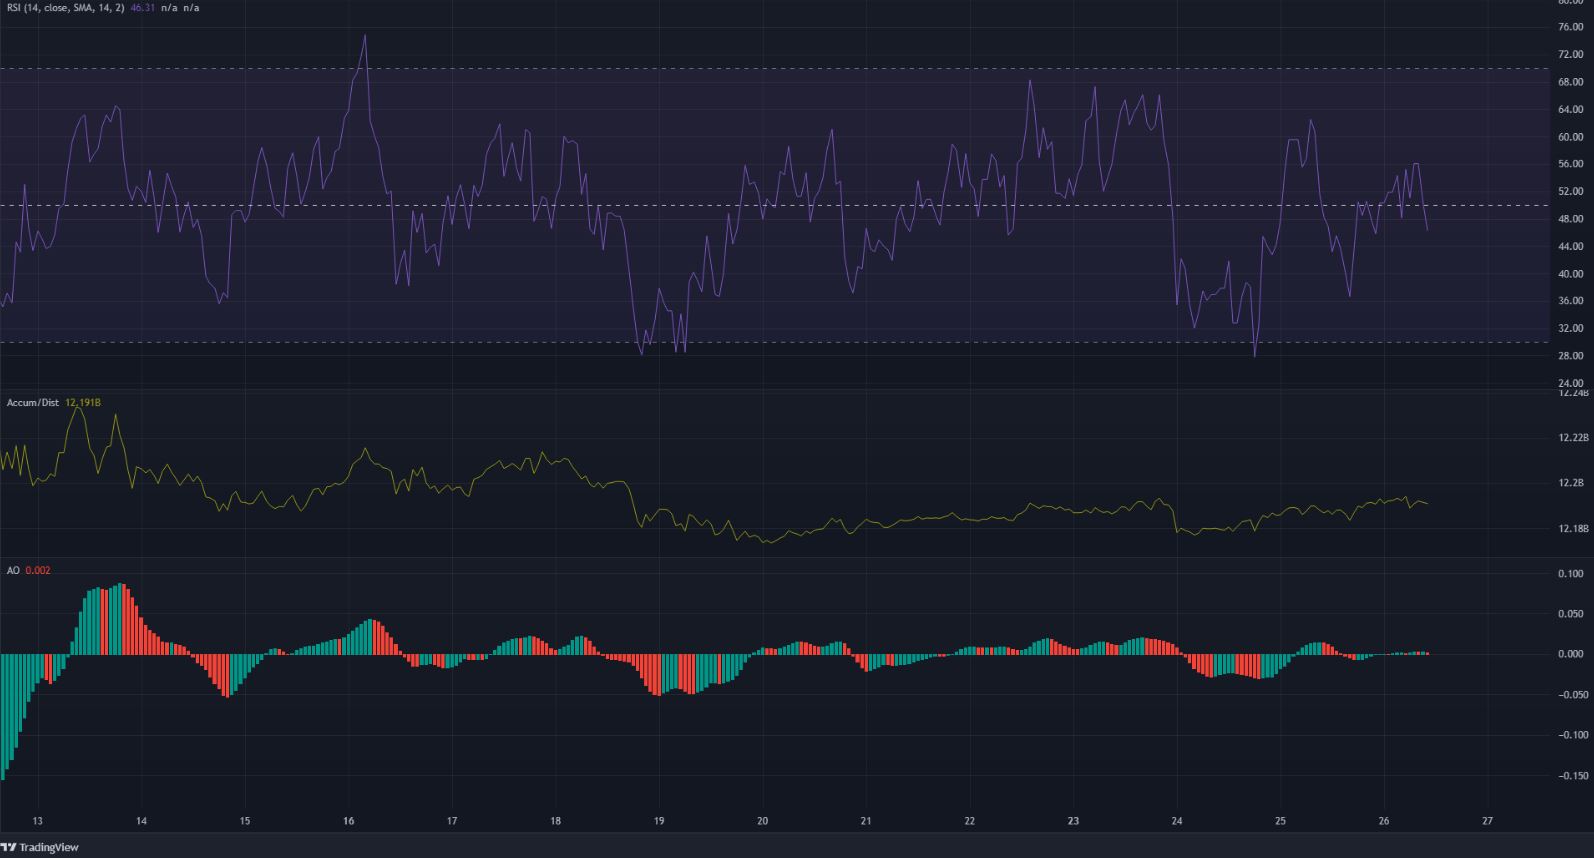
The RSI on the hourly chart has climbed past the 60 level and dropped below the 40 level multiple times in the past week and a half, to show that a strong trend was not in play. Rather, momentum has been oscillating between bullish and bearish hands. At press time, the RSI was at 45 to show slightly bearish momentum.
Similarly, the Awesome Oscillator also stood quite close to the zero mark at 0.02 at the time of writing, to show the lack of strong momentum in recent hours. The A/D line was in a downtrend up to 20 May, but it slowly started picking up since then.
Conclusion
The $0.61-$0.62 area can be a buying opportunity since they represent the range lows. Risk management would be important, as a drop beneath the range can not be ruled out. The mid-point of the range at $0.677 can be used to take profit, and perhaps even move the stop-loss up to breakeven if necessary.