
- Whale movements of $154.3M and $11.45M suggest accumulation, supported by bullish on-chain signals.
- Technical indicators remain mixed, with slight bullish momentum.
Recently, whale activity surrounding Polygon [MATIC] has drawn significant attention, particularly after notable transactions on major exchanges such as Binance and OKEx.
Binance recorded two significant transfers of 200 million MATIC each, while OKEx witnessed a transfer of 30 million MATIC. These transactions are valued at approximately $154.3 million and $11.45 million, respectively.
MATIC was trading at $0.3754 at the time of press, reflecting a 0.90% decline over the past 24 hours.
When whales move such large sums, it often hints at impending shifts in the market. This could indicate accumulation or liquidation, which can profoundly affect MATIC’s price trajectory.
However, the critical question remains: Does this whale activity present a buying opportunity for traders?
What does technical analysis say?
The RSI at 51.74 indicated a neutral position. This suggests that MATIC is neither overbought nor oversold, signaling consolidation and potential for a breakout in either direction.
The Bollinger Bands show that the price is close to the lower band, which could indicate an oversold condition, often a precursor to a price recovery.
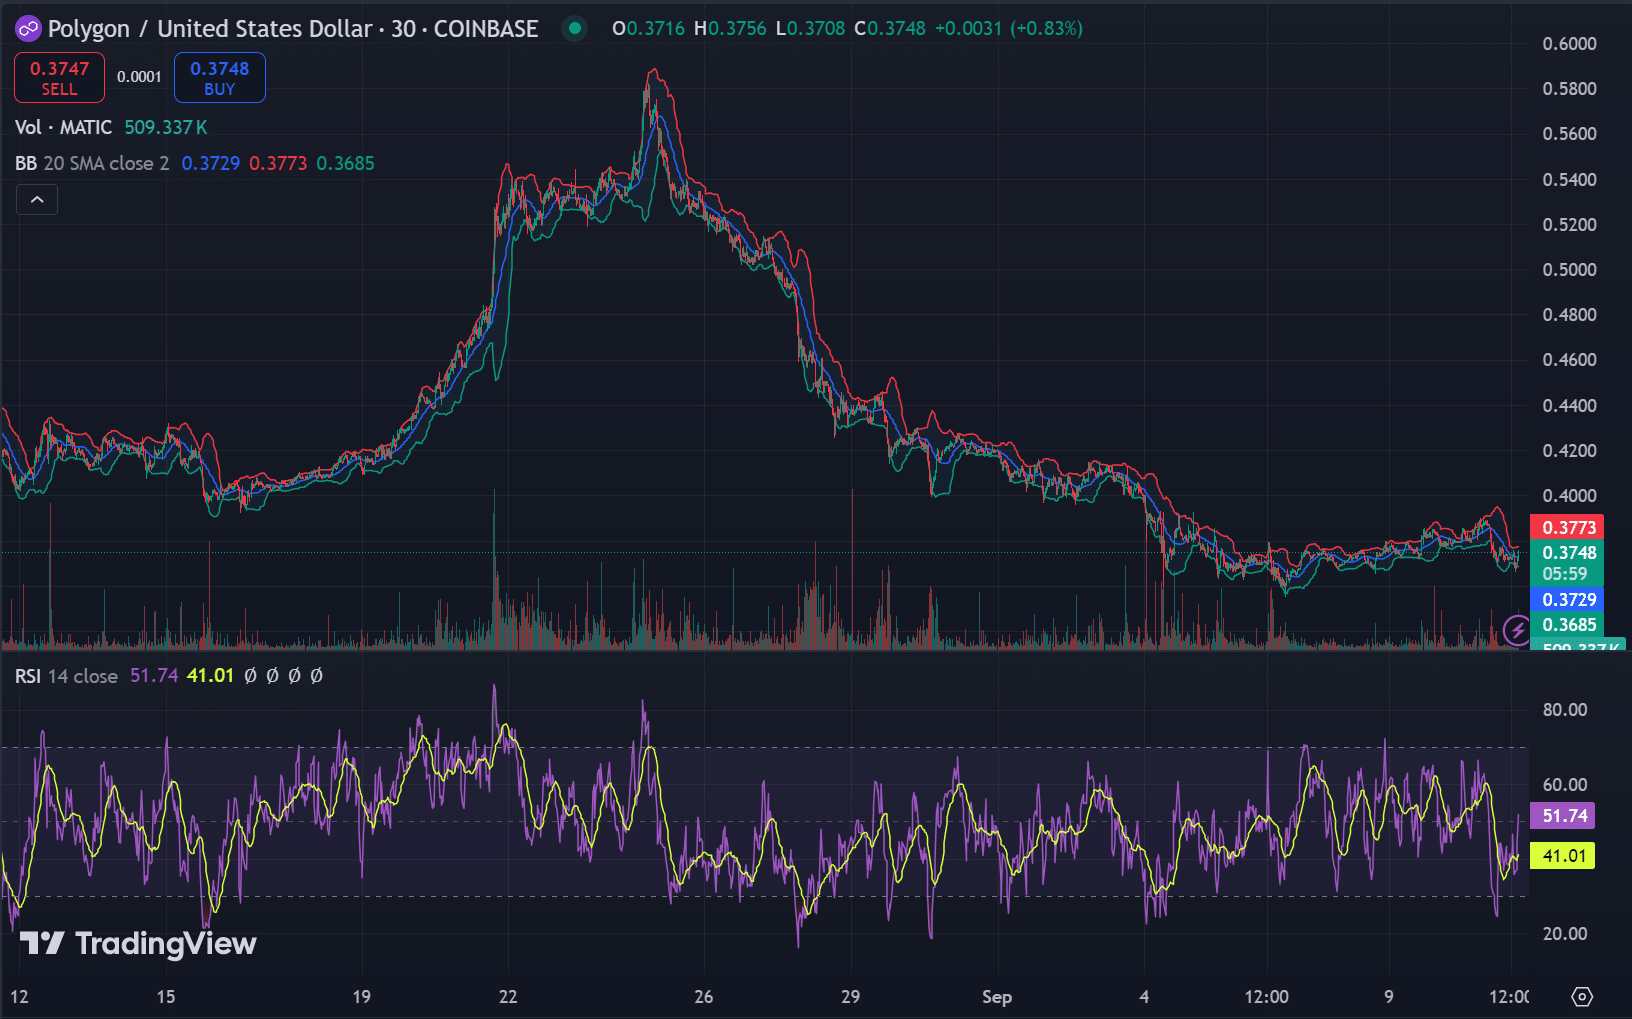
Source: TradingView
The MACD indicator also offers a glimpse into the market’s current momentum. The MACD line (0.0006) has crossed slightly above the signal line (0.0003), showing a modest bullish divergence.
However, the histogram value of 0.0003 indicates that the momentum is still weak, and stronger confirmation is needed to confidently call this a trend reversal.
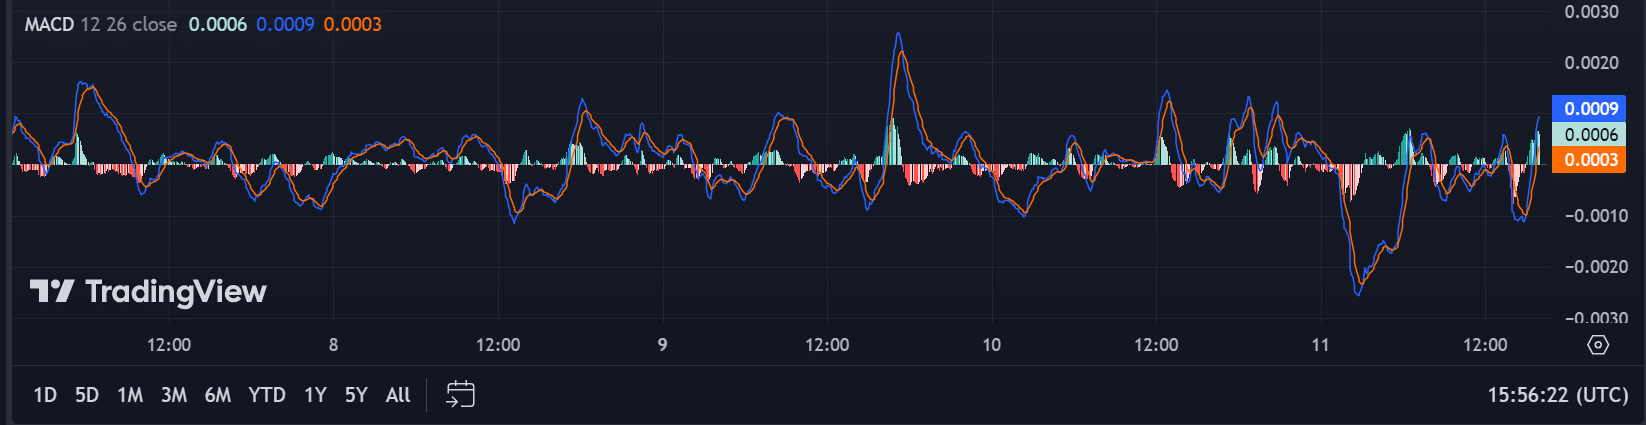
Source: TradingView
However, the histogram value of 0.0003 indicates that the momentum is still weak, and stronger confirmation is needed to call this a trend reversal confidently.
Are on-chain metrics bullish?
The available on-chain signals show bullish trends, with net network growth at 0.33%, concentration of large holders at 0.25%, and large transactions registering a 2.92% increase.
These metrics point toward an increase in whale activity, suggesting that large holders may be accumulating MATIC tokens in anticipation of a future price increase.
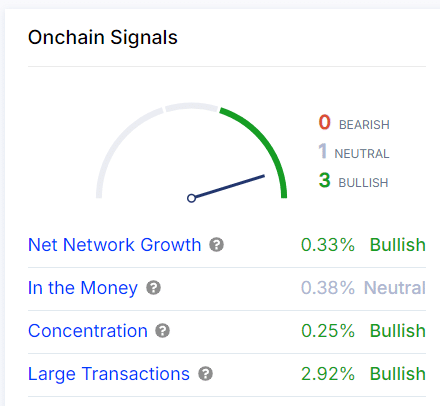
Source: IntoTheBlock
Buying opportunity or caution?
While whale activity and on-chain data suggest a positive outlook for MATIC, technical analysis remains mixed.
The RSI and MACD indicate consolidation with only slight bullish signals, suggesting that traders might want to wait for stronger confirmation before making significant moves.
Is your portfolio green? Check out the MATIC Profit Calculator
However, for long-term investors, the current whale activity and bullish on-chain signals could indicate a favorable time to accumulate MATIC.
As always, it is crucial to employ robust risk management strategies when considering new positions in volatile markets like cryptocurrency.