MATIC’s price edges closer to a 35% breakout; can it invalidate its losses soon

MATIC price is closing in on breaking out of a massive bullish pattern. On-chain metrics are also hinting at an optimistic outlook for Polygon. Additionally, with Bitcoin flipping bullish, altcoins, including MATIC might also witness gains.
Gains and more gains
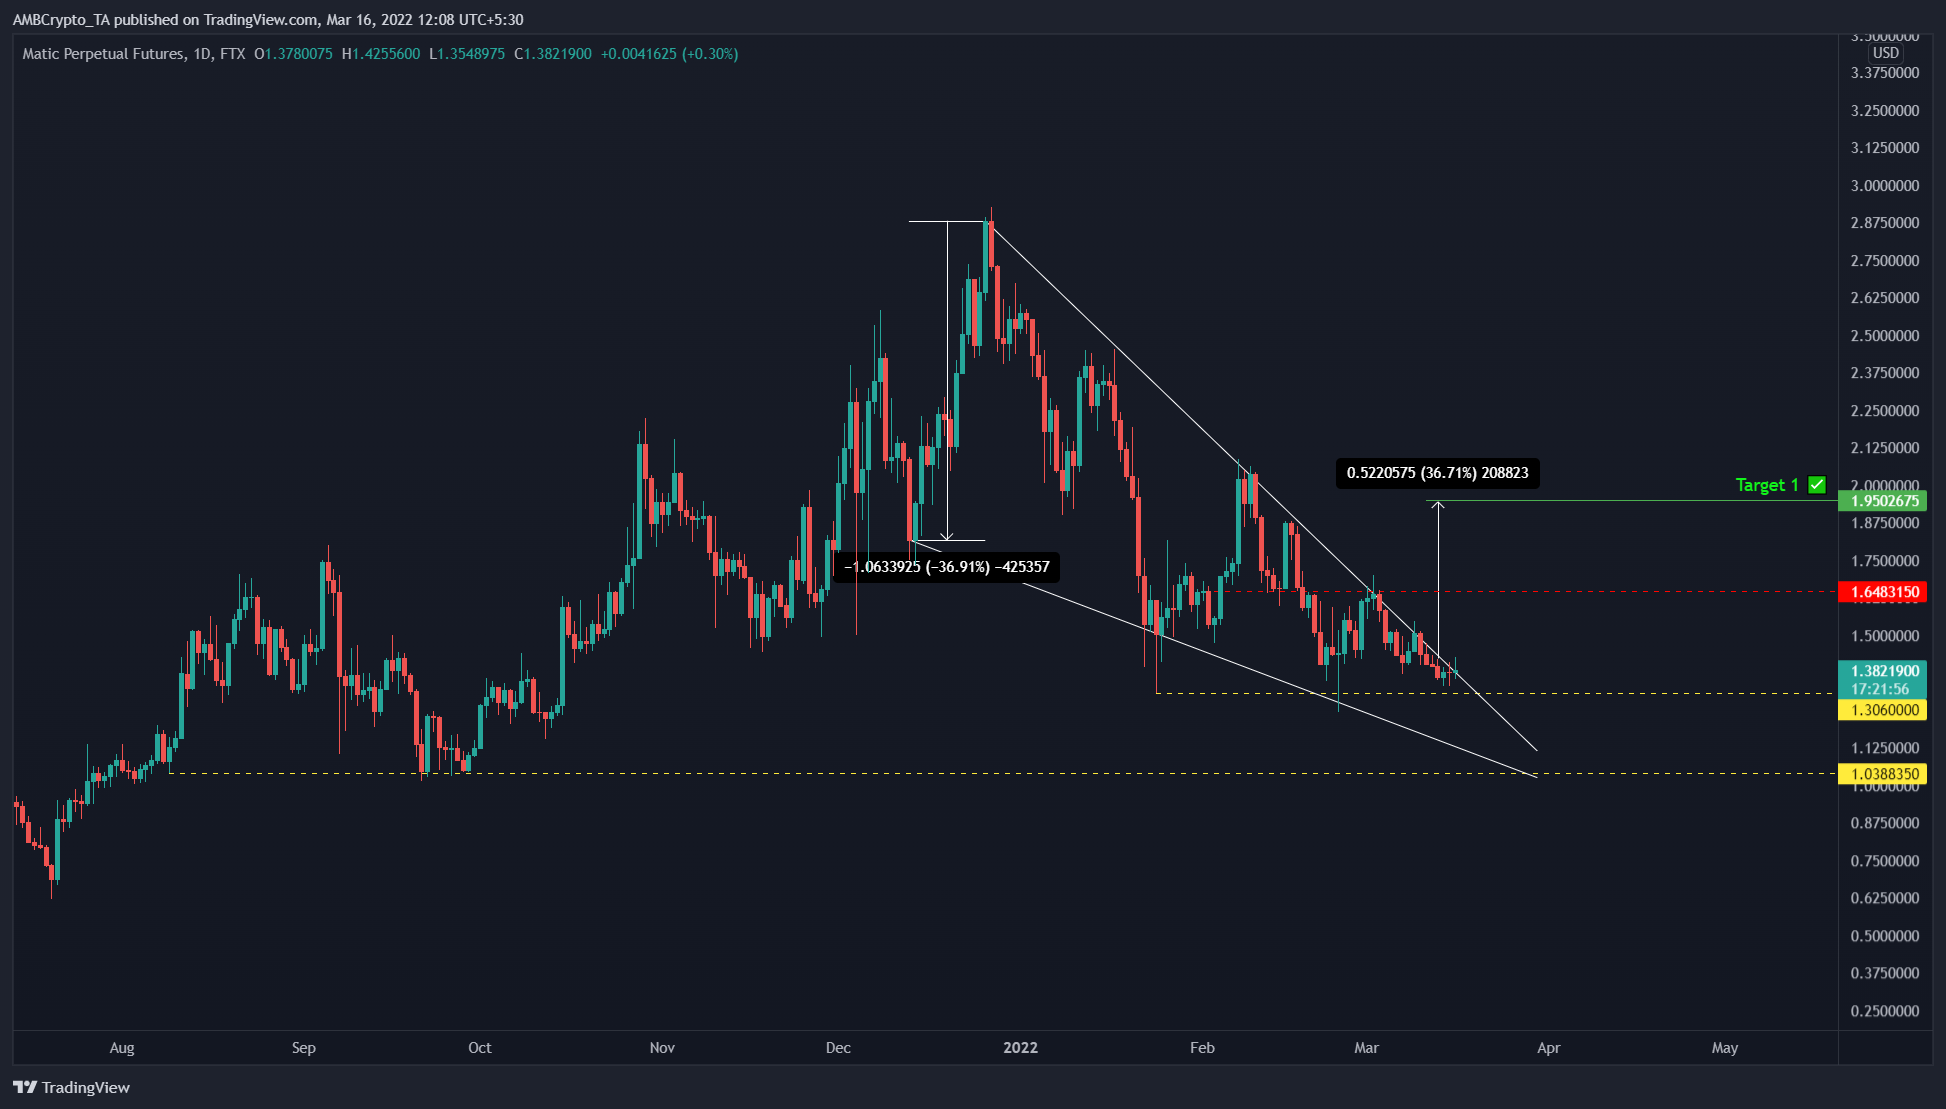
From 13 December 2021 to 16 March, MATIC price set up four lower highs and three lower lows. Connecting these swing points using trend lines shows a falling wedge in formation. This technical pattern favors the bulls and the target is obtained by adding the distance between the first swing and swing low to the breakout point at $1.42.
MATIC price is getting squeezed as it approaches the end of the falling wedge. Due to the convergence of the trend lines, the volatility has decreased quite a lot; so a breakout from this area will be the key to seeing the volatility explode again. Interestingly, the daily demand zone, extending from $1.15 to $1.36 is present just around the level that Polygon was currently trading at the time of writing.
Hence, a bounce off this significant support area will help kick-start a bull run. The target based on the falling wedge forecast is at $1.94, but in a bullish case, investors can expect MATIC price to extend this run-up and tag the $2 psychological level.
In total, this run-up would constitute a 43% gain and is likely where the upside will be capped.
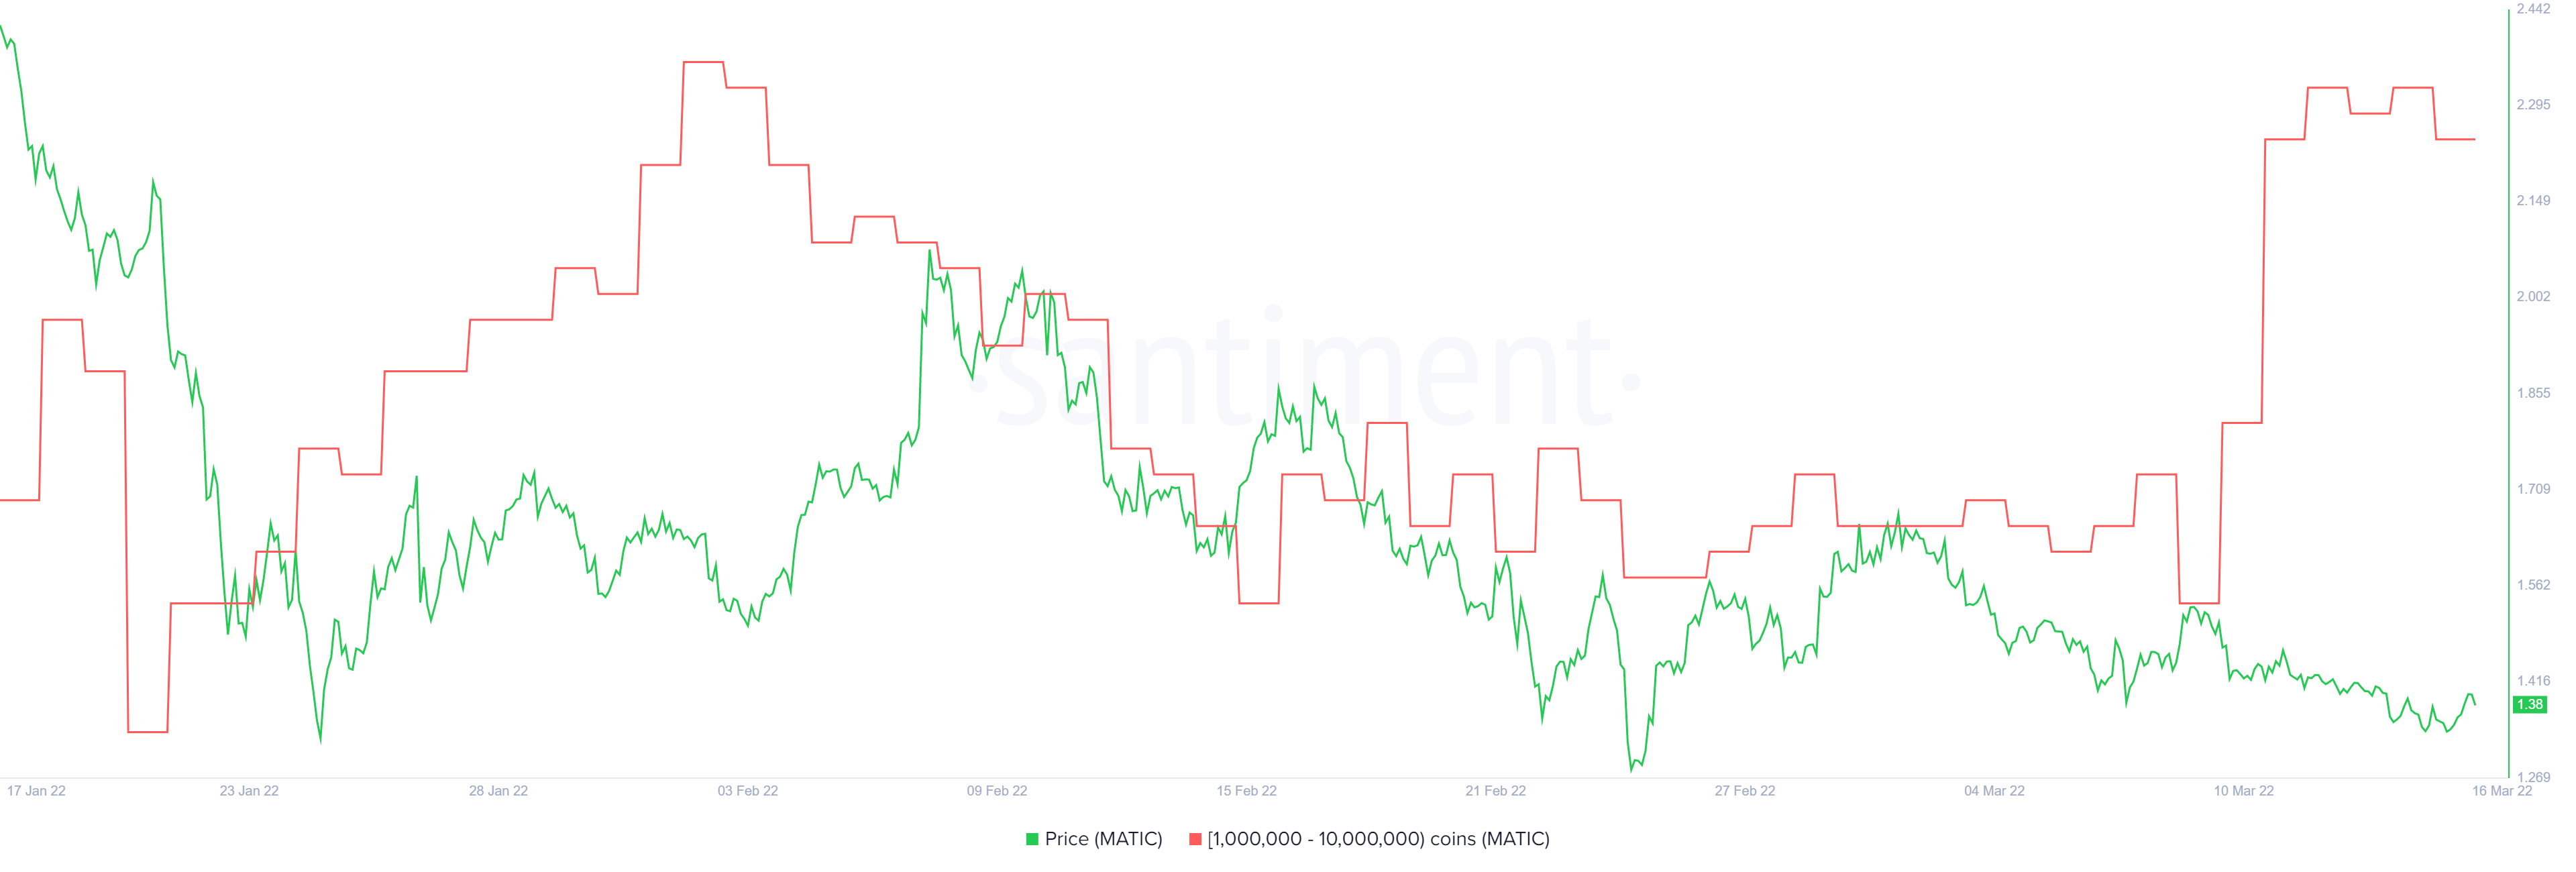
Supporting this optimistic outlook for the Layer 2 token is the supply distribution chart sorted by the number of addresses. This on-chain metric shows that wallets holding one million to 10 million MATIC tokens have increased from 183 to 201 in the last week.
This 10% spike in whales indicates that this high networth and long-term investors are interested in Polygon at the current price levels and are expecting a bullish outlook.
Interestingly, the last time the number of such whales increased from 178 to 204 was in early January. At the time, MATIC’s price rallied 50% in less than two weeks.
The on-chain metrics correctly posit the outlook described from a technical perspective. Therefore, market participants need to wait patiently for Polygon to produce a decisive close above the falling wedge’s upper trend line at roughly $1.40. Such a development will open the door for bulls to kick-start the run-up to $2.
However, a daily candlestick close below the $1.15 support level will invalidate the bullish thesis detailed above.