MATIC’s price long-term play could yield capital-doubling gains

MATIC price is stabilizing after more than three months of a steady downtrend from a peak of $2.92. This move provides swing traders and long-term holders an opportunity to accumulate the token at a discount before the trend reverses and the altcoin embarks on a massive and exponential uptrend.
MATIC price in the calm before a massive storm
MATIC price has crashed a whopping 55% in the last three months or so from its all-time high at $2.92. This downswing was mainly caused by a trend change in the crypto space as Bitcoin prices dropped from $69,000 to nearly $33,000.
Like all altcoins, MATIC price followed the king coin’s footsteps, leading to a massive turnaround. Regardless, Polygon seems to have cauterized the bleeding at around the $1.30 support level.
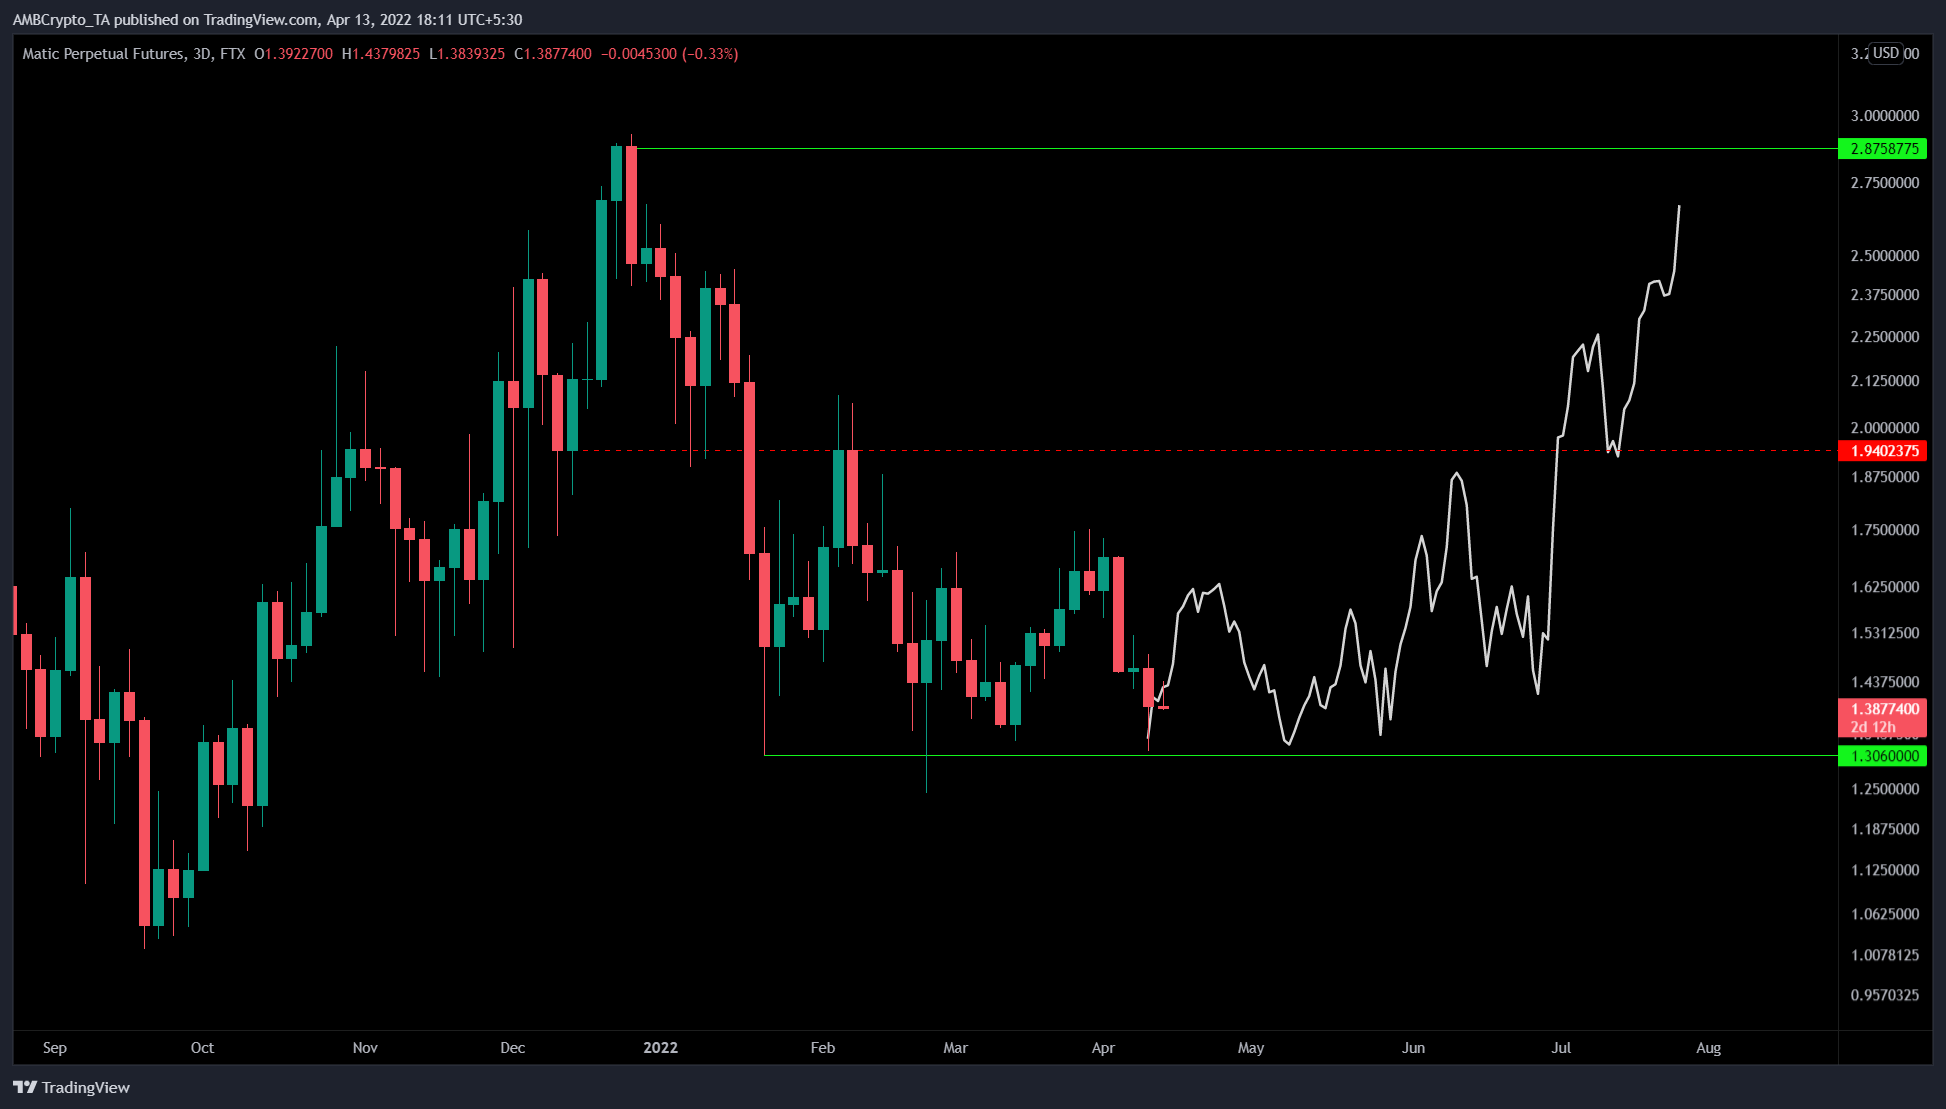
Since the first retest on 22 January, MATIC’s price has tagged the $1.30 level multiple times. And, every time, this barrier has served as a stable support floor, allowing sidelined buyers to prop the market value of this Layer-2 token.
After its 30% run-up in March, MATIC price has undone its gains and then gained some value again to retest the aforementioned support barrier. However, this time around, the altcoin seems to be forming a base in preparation for further gains.
As seen in the chart, the projected trajectory of the MATIC price (in white) tries to forecast how the price action could develop. There is a high chance for buyers and sellers to grapple, leading to a sideways movement, which will eventually lead to an explosive move.
The resulting upswing will first face the resistance barrier at $1.94 after a 40% upswing. If the bullish momentum is enough, MATIC’s price will flip this hurdle into a foothold, giving way for more buyers to step in.
In such a case, Polygon is likely to continue heading higher and retest its all-time high at $2.92. This run-up would form a rounded bottom, suggesting a trend reversal favoring the bulls.
In total, this move would constitute a 100% gain and is likely where MATIC price will see a considerable profit-taking activity occur. Thus, causing a minor retracement or sideways movement.
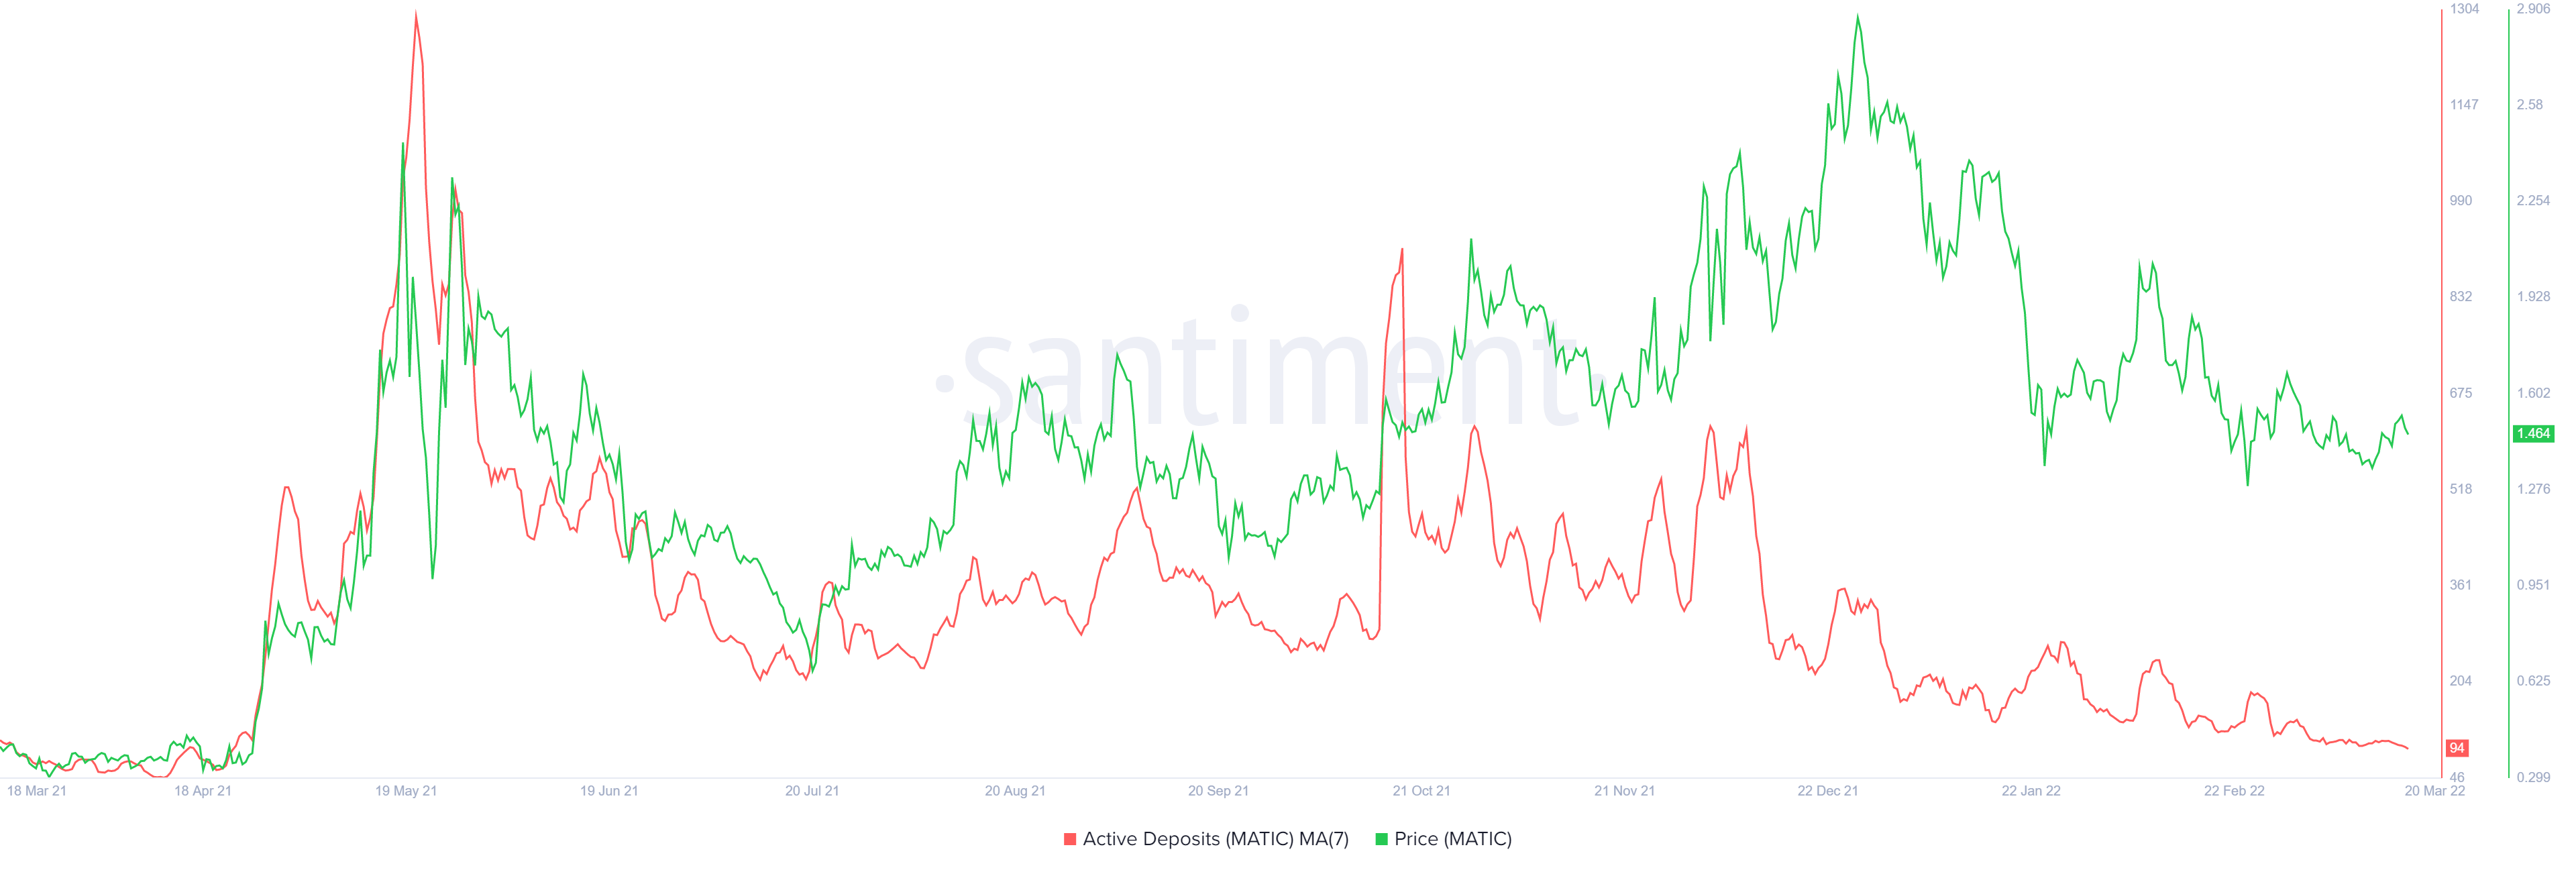
Supporting this massive, yet obtainable trend for MATIC price is the active deposit metric. This on-chain index tracks the incoming deposits to centralized platforms and can be used to determine the formation of local tops and potential areas of profit-taking.
Since May 2021, the number of active deposits has been on a downtrend from 1291 to 94. This largescale downswing indicates that investors are not interested in selling and are likely to hold their tokens, further supporting the bullish outlook explained from a technical standpoint.