
Disclaimer: The findings of the following analysis are the sole opinions of the writer and should not be considered investment advice
- The market structure on lower timeframes flipped bullishly but momentum was not strong
- The lack of demand over the weekend meant patience could be key
Polygon’s zkEVM passed 99.5% of Ethereum test vectors, which put Polygon zkEVM at a very high EVM equivalence. Furthermore, researchers of the Polygon PoS chain have been working on ways to increase the performance of the chain.
Read Polygon’s [MATIC] Price Prediction 2023-2024
The long-term price prediction for the asset was hopeful and put MATIC near the $25 mark by 2030. While that prediction was stood far away, the shorter-term analysis showed $0.94 was a reasonable target for MATIC bulls in the coming days.
$0.9 was retested as support but the bearish order block to the north was yet to be tested
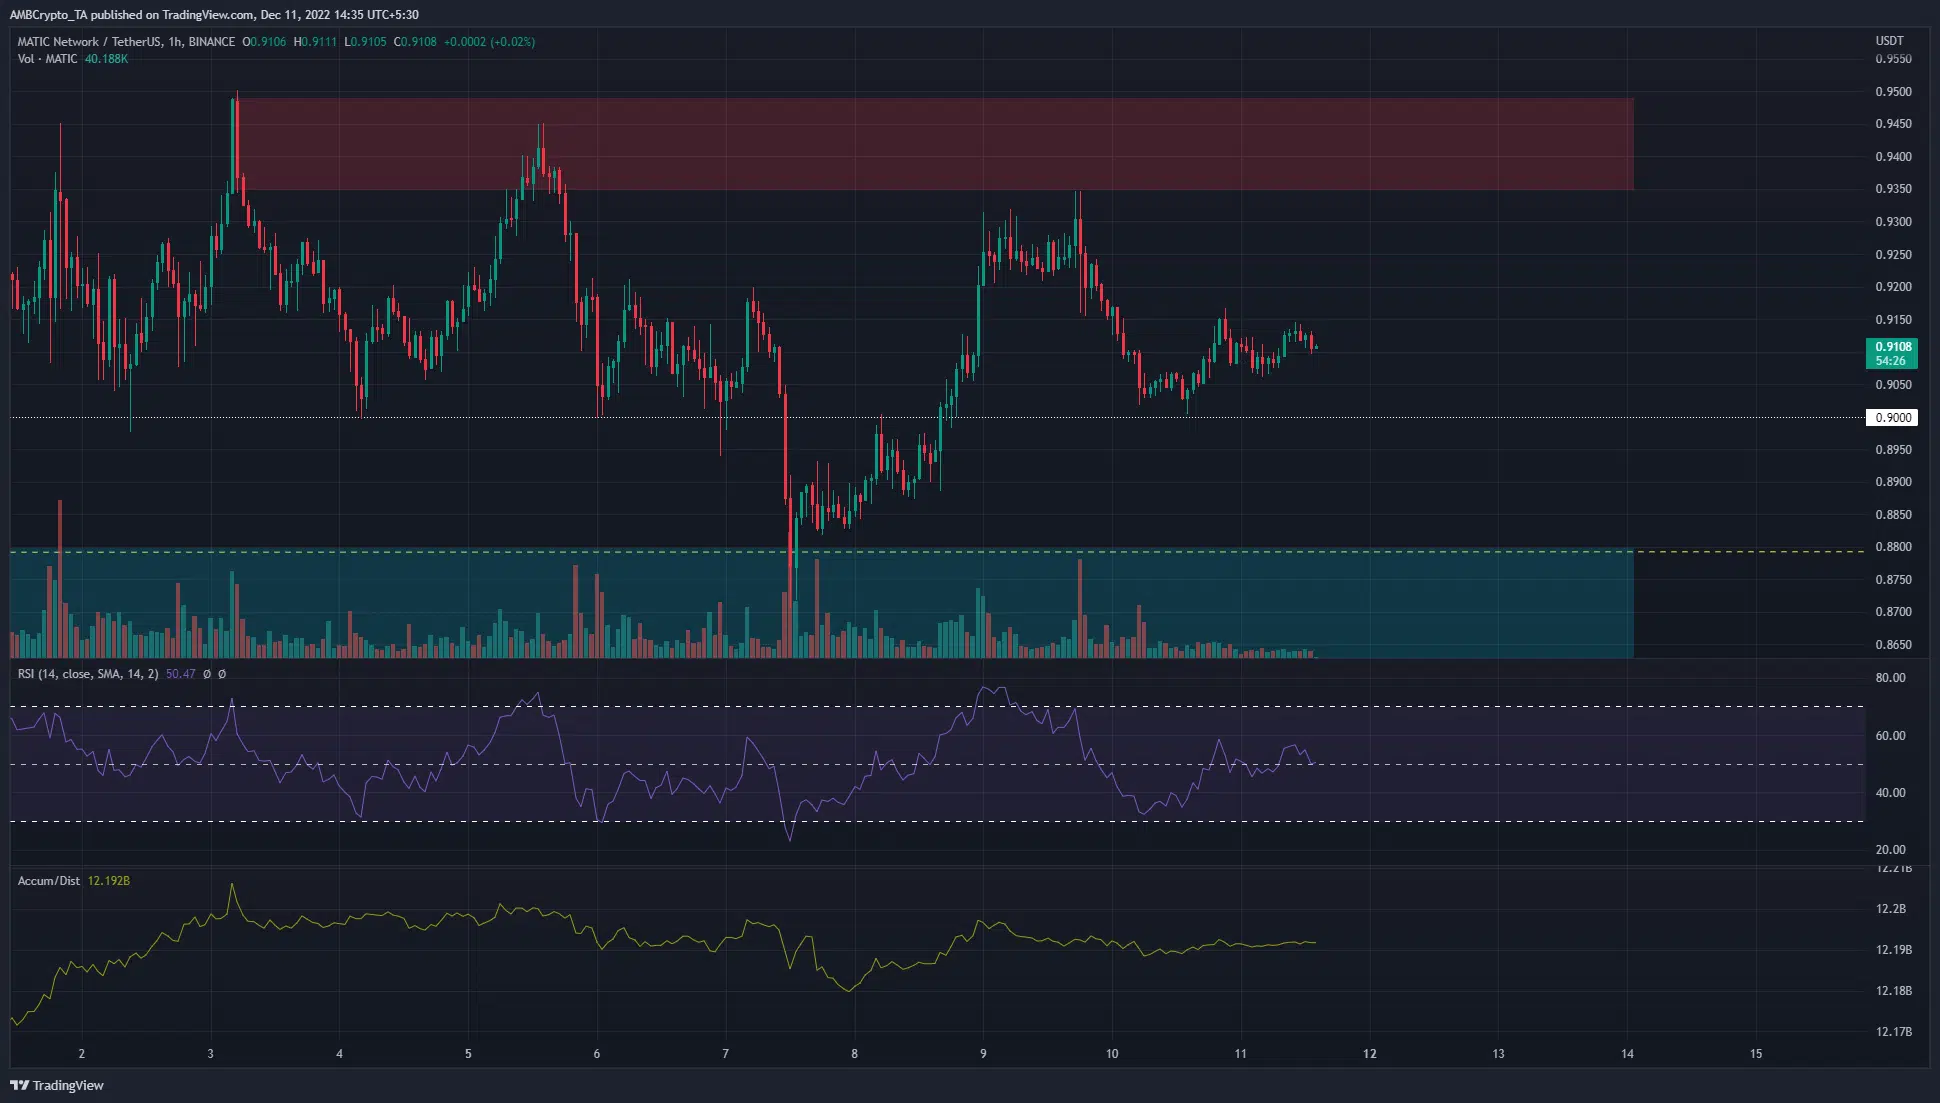
Source: MATIC/USDT on TradingView
Over the past week of trading, MATIC oscillated between $0.94 and $0.9 on the charts. On 7 December, it dipped to $0.871, but was able to recover quickly thereafter. The $0.9 level was flipped to support once again.
The Relative Strength Index (RSI) stood near 50 and the previous day’s trading did not show momentum toward either direction. This can be attributed to a lack of volatility over the weekend, with Bitcoin [BTC] also relatively stationary on the charts. The Accumulation/Distribution (A/D) indicator did not climb in recent days either.
Therefore, neither momentum nor accumulation favored the bulls. However, the price action has a lower timeframe bullish tinge. The drop into the $0.88 zone represented a test of a bullish breaker formed on the four-hour chart on November 24.
A bearish order block on the one-hour chart was seen at $0.94, highlighted in red. Moreover it was in proximity to the $0.93-$0.94 area, which has had significance since mid-September. The $0.96 and $1 levels will also posed stern challenges to the bulls.
While the longer-term market structure wasn’t yet bullish, it was possible that MATIC could see a foray northward in search of liquidity.
Mean coin age falls alongside network growth over the past month
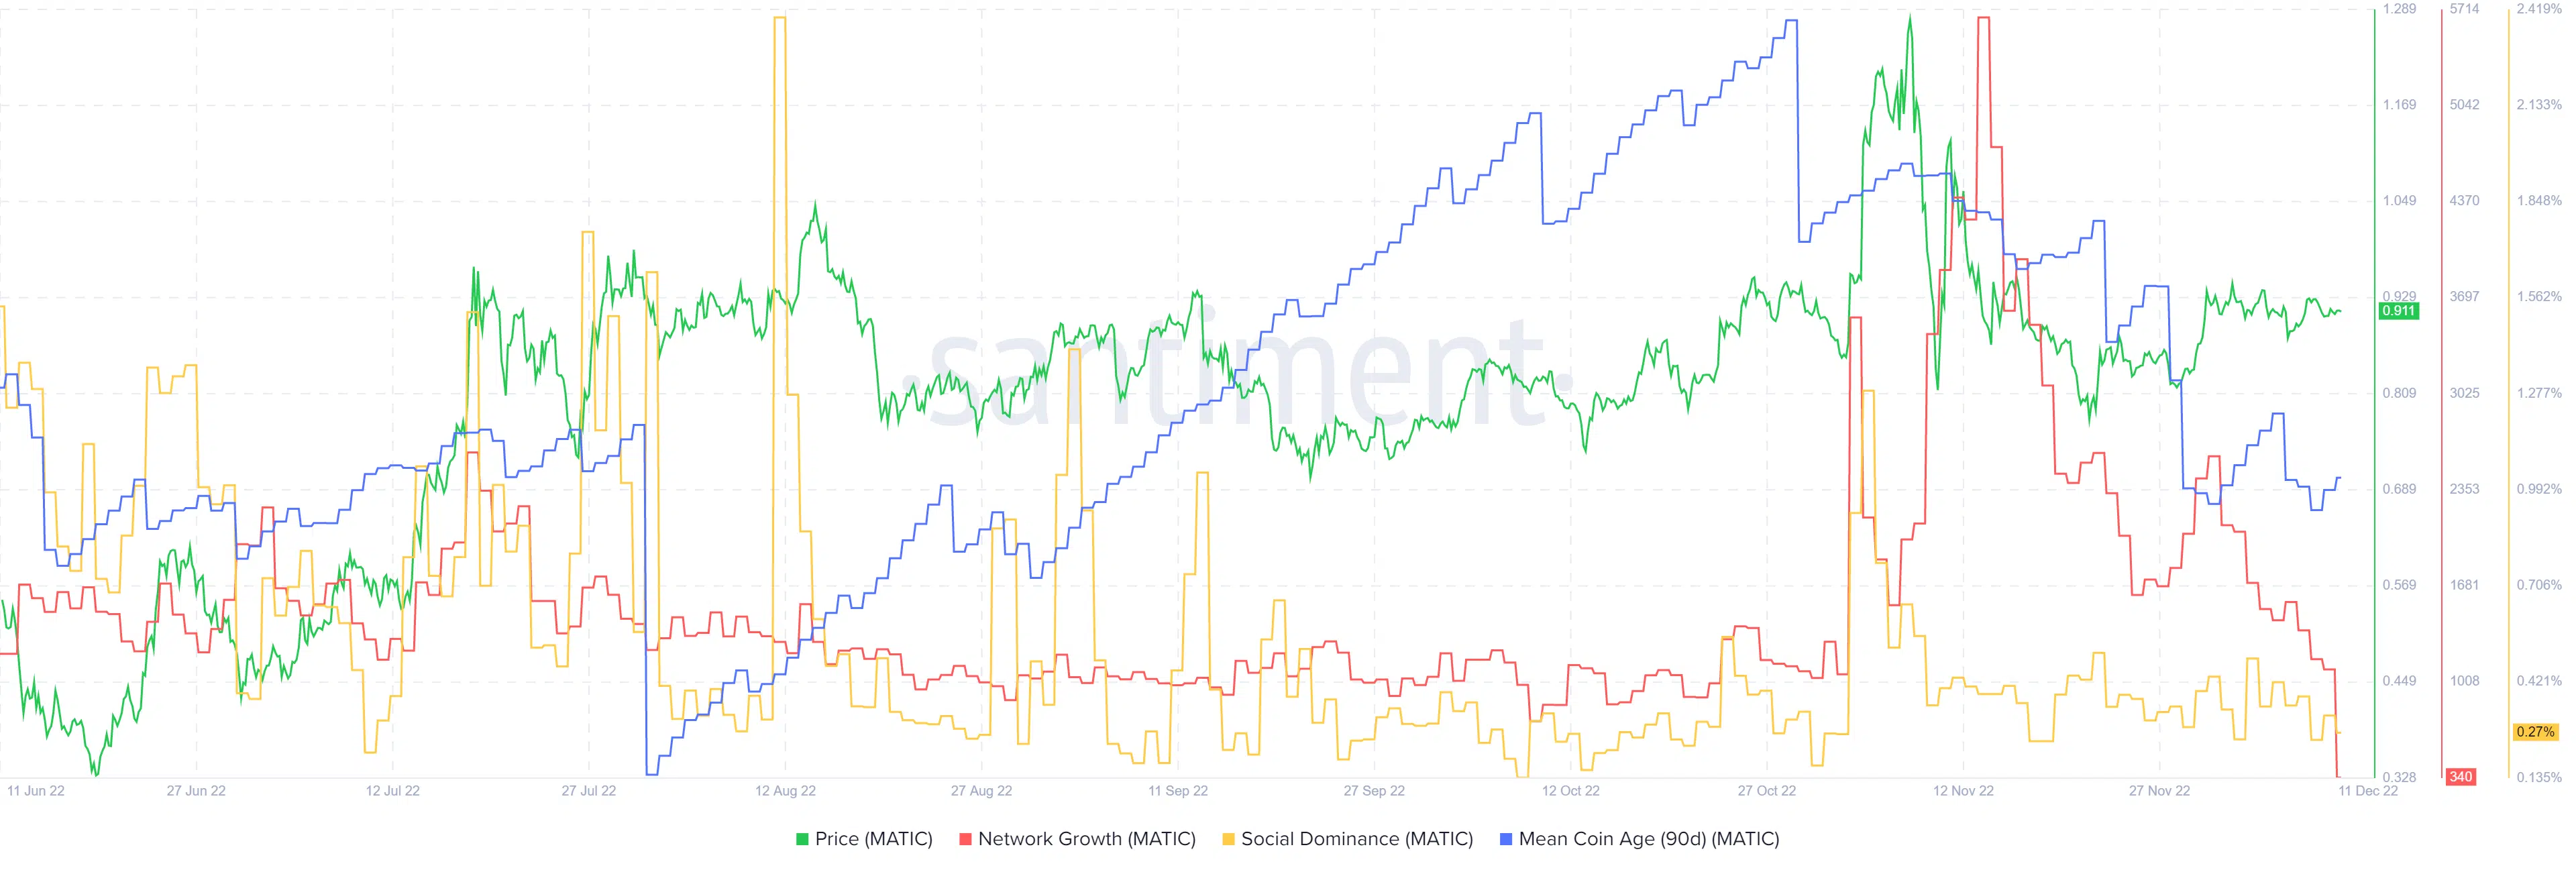
Source: Santiment
The A/D indicator was flat, and on-chain metrics also agreed with the idea of short-term holders being scarce. The three-month mean coin age metric was in a downtrend over the past month and showed that addresses were distributing MATIC tokens, not accumulating.
The network growth metric slumped sharply over the past few days. Social Dominance was also near the lows from November. Together, they suggested that engagement and hype in the token and network was relatively low, which could slow down the bullish attempts to drive prices higher.