
Disclaimer: The findings of the following analysis are the sole opinions of the writer and should not be considered investment advice
- MATIC has seen extreme volatility in the past month
- It had some bullish momentum even on the higher timeframes, and a move toward $1 was likely
MATIC has made good gains after its drop to $0.77 on 21 November. During this time, Bitcoin has also rallied slightly from $15.6k to $17k. While MATIC had a bullish market structure, further gains could be dependent on Bitcoin’s mood.
Read MATIC’s Price Prediction 2023-24
If Bitcoin can break past the resistance at $17.6k, it could drag the altcoin market upward. Meanwhile, a move below $16.6k could see MATIC drop below $0.89. On lower timeframes, MATIC offered a buying opportunity as it neared the range lows.
Short-term consolidation could see a test of the mid-range and a move upward to $1
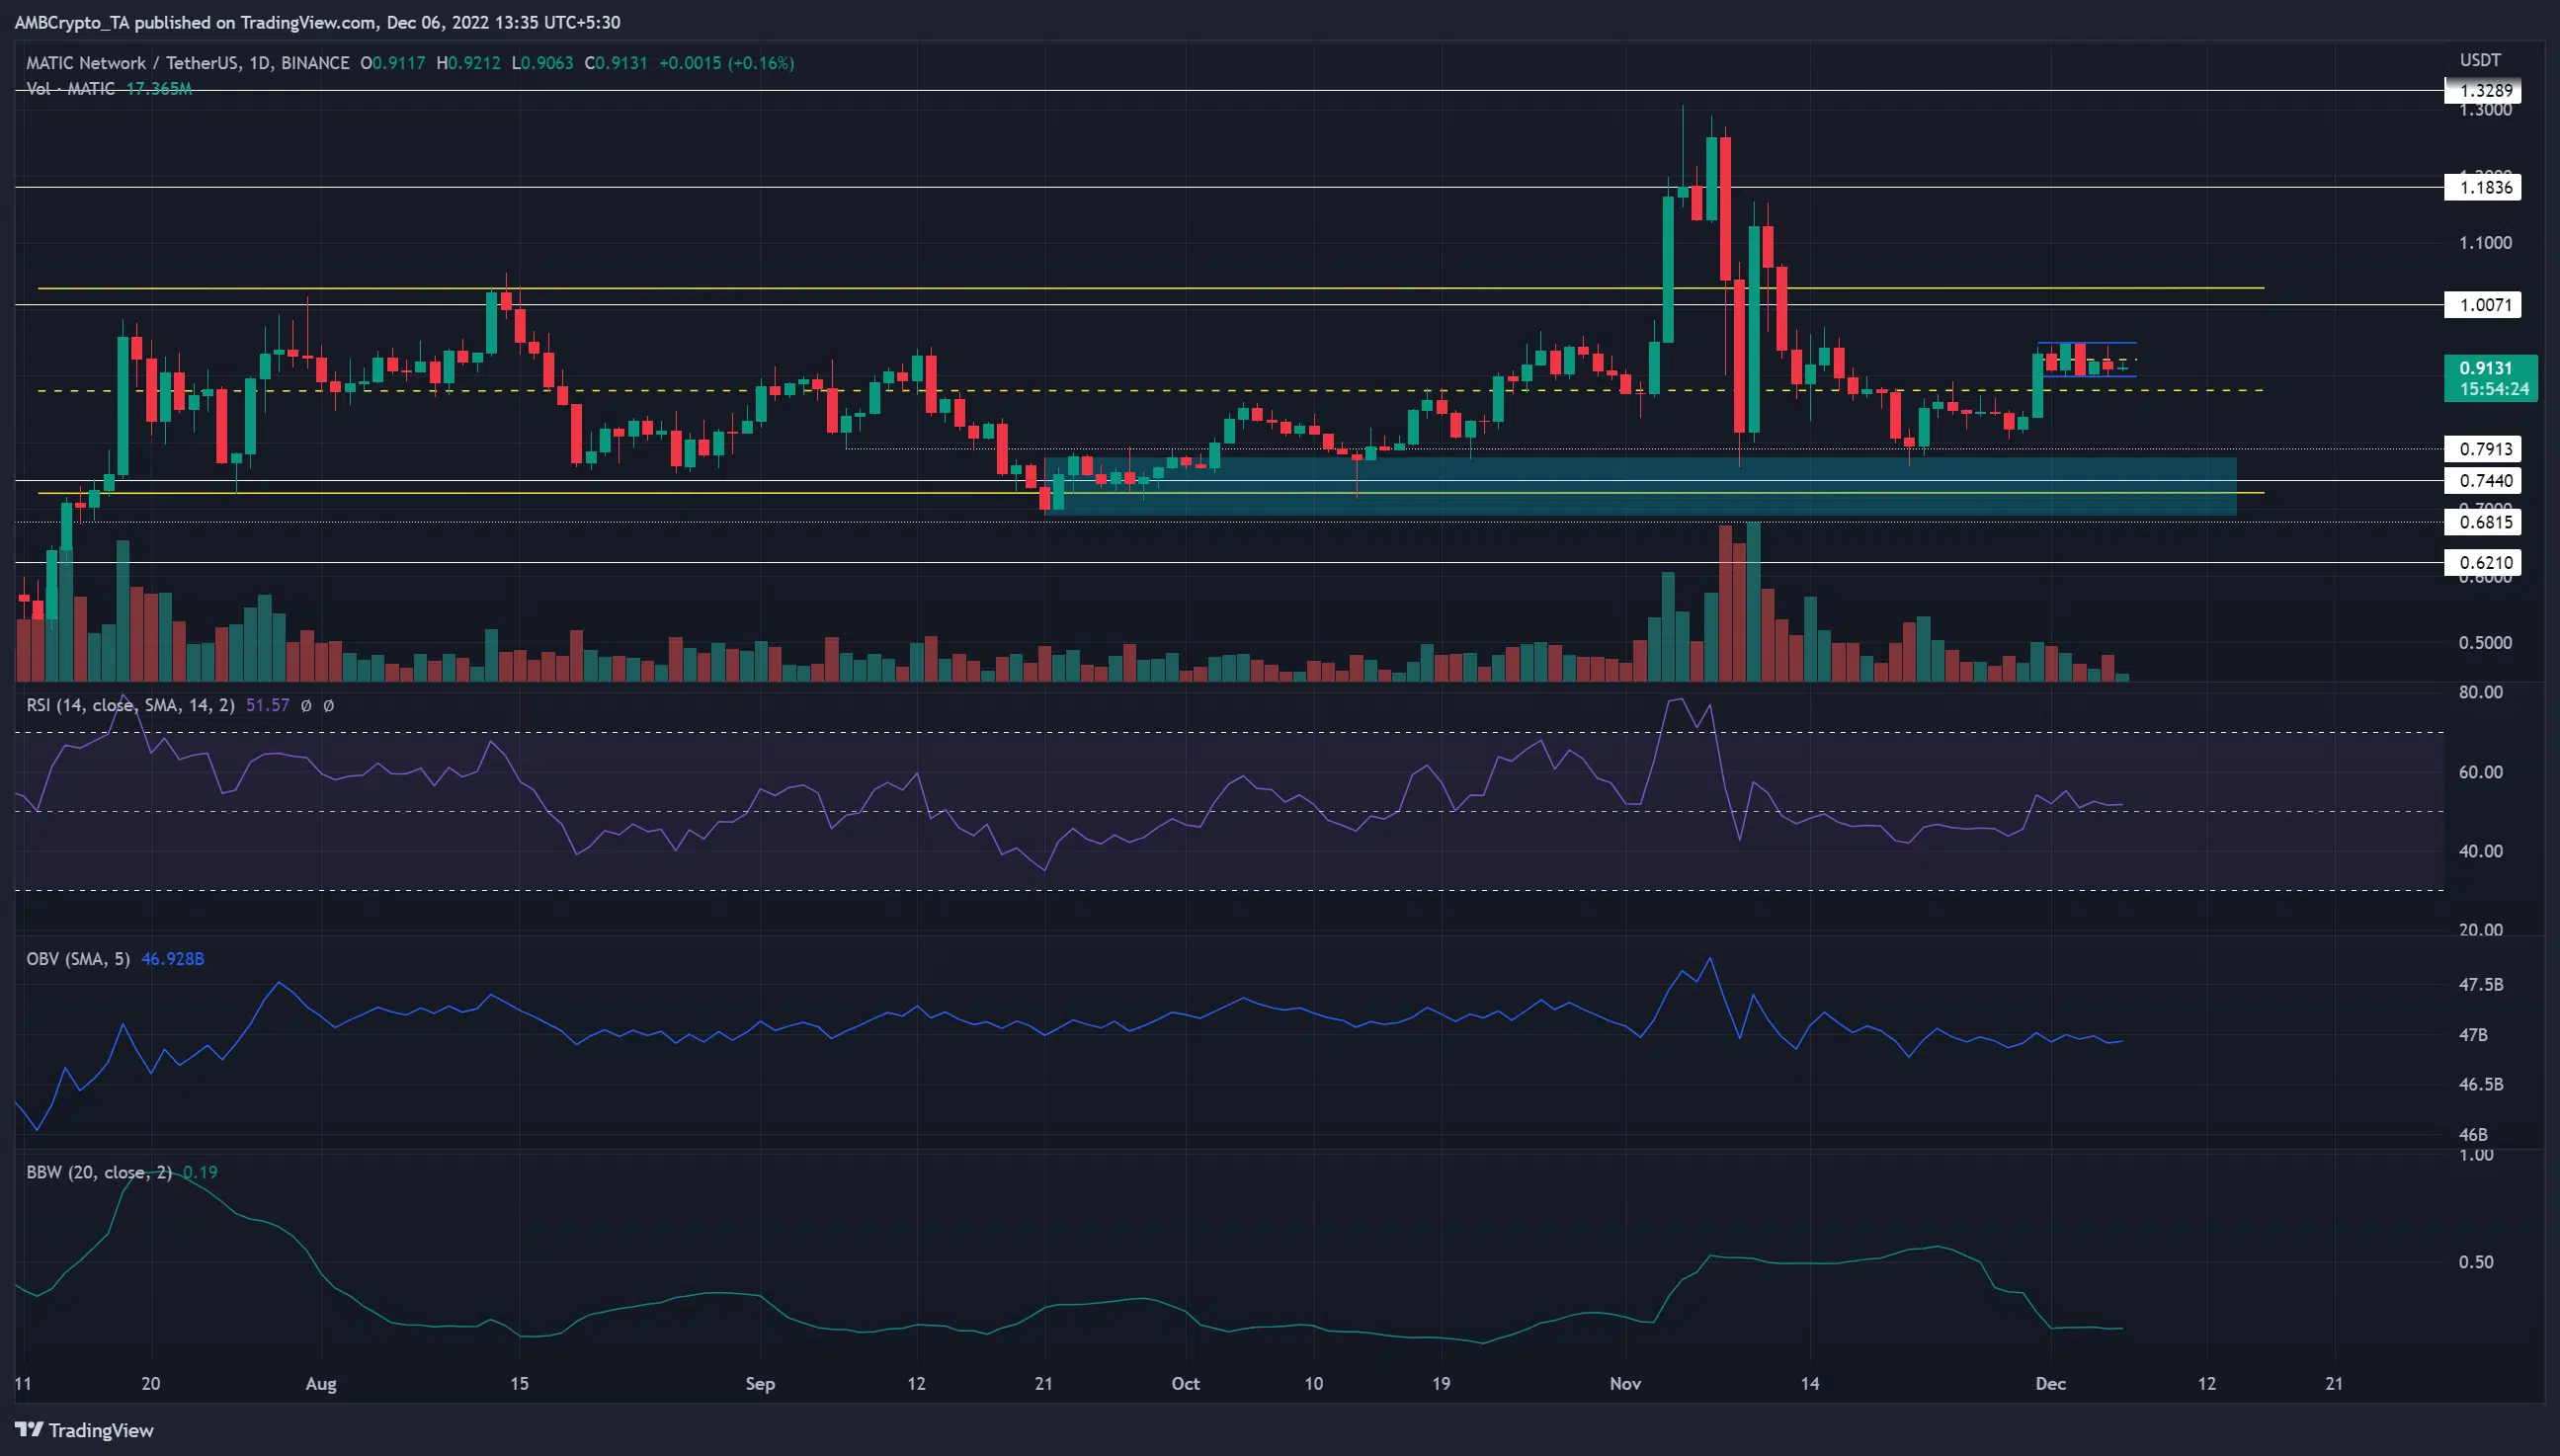
Source: MATIC/USDT on TradingView
In September, MATIC registered a bullish order block in the $0.73 region. Highlighted in cyan, this area has served as a good demand zone in recent months. However, on the higher timeframes, MATIC was still stuck in a range (yellow) from $0.725 to $1.03.
This range was violently broken in early November when MATIC pumped as high as $1.26. Just a few days later, the price plummeted as fear gripped the market. The FTX collapse saw MATIC post losses of nearly 40% from $1.26 to $0.77.
Immediately thereafter the price bounced to $1.12 before falling toward $0.77 once more. This volatility was great for lower timeframe traders, but it also posed a substantial risk.
Since 30 November, the native token of Polygon saw reduced volatility. It traded between the $0.899 and $0.945 levels over the past week, in a lower timeframe range highlighted in blue.
The RSI stood just above neutral 50 and did not show strong momentum in either direction, while the OBV was also relatively flat in recent weeks. A strong trend was not in progress, although the daily market structure was bullish. Meanwhile, the Bollinger bands width indicator fell sharply to denote reduced volatility.
MVRV was back in negative territory after aggressive profit-taking in November
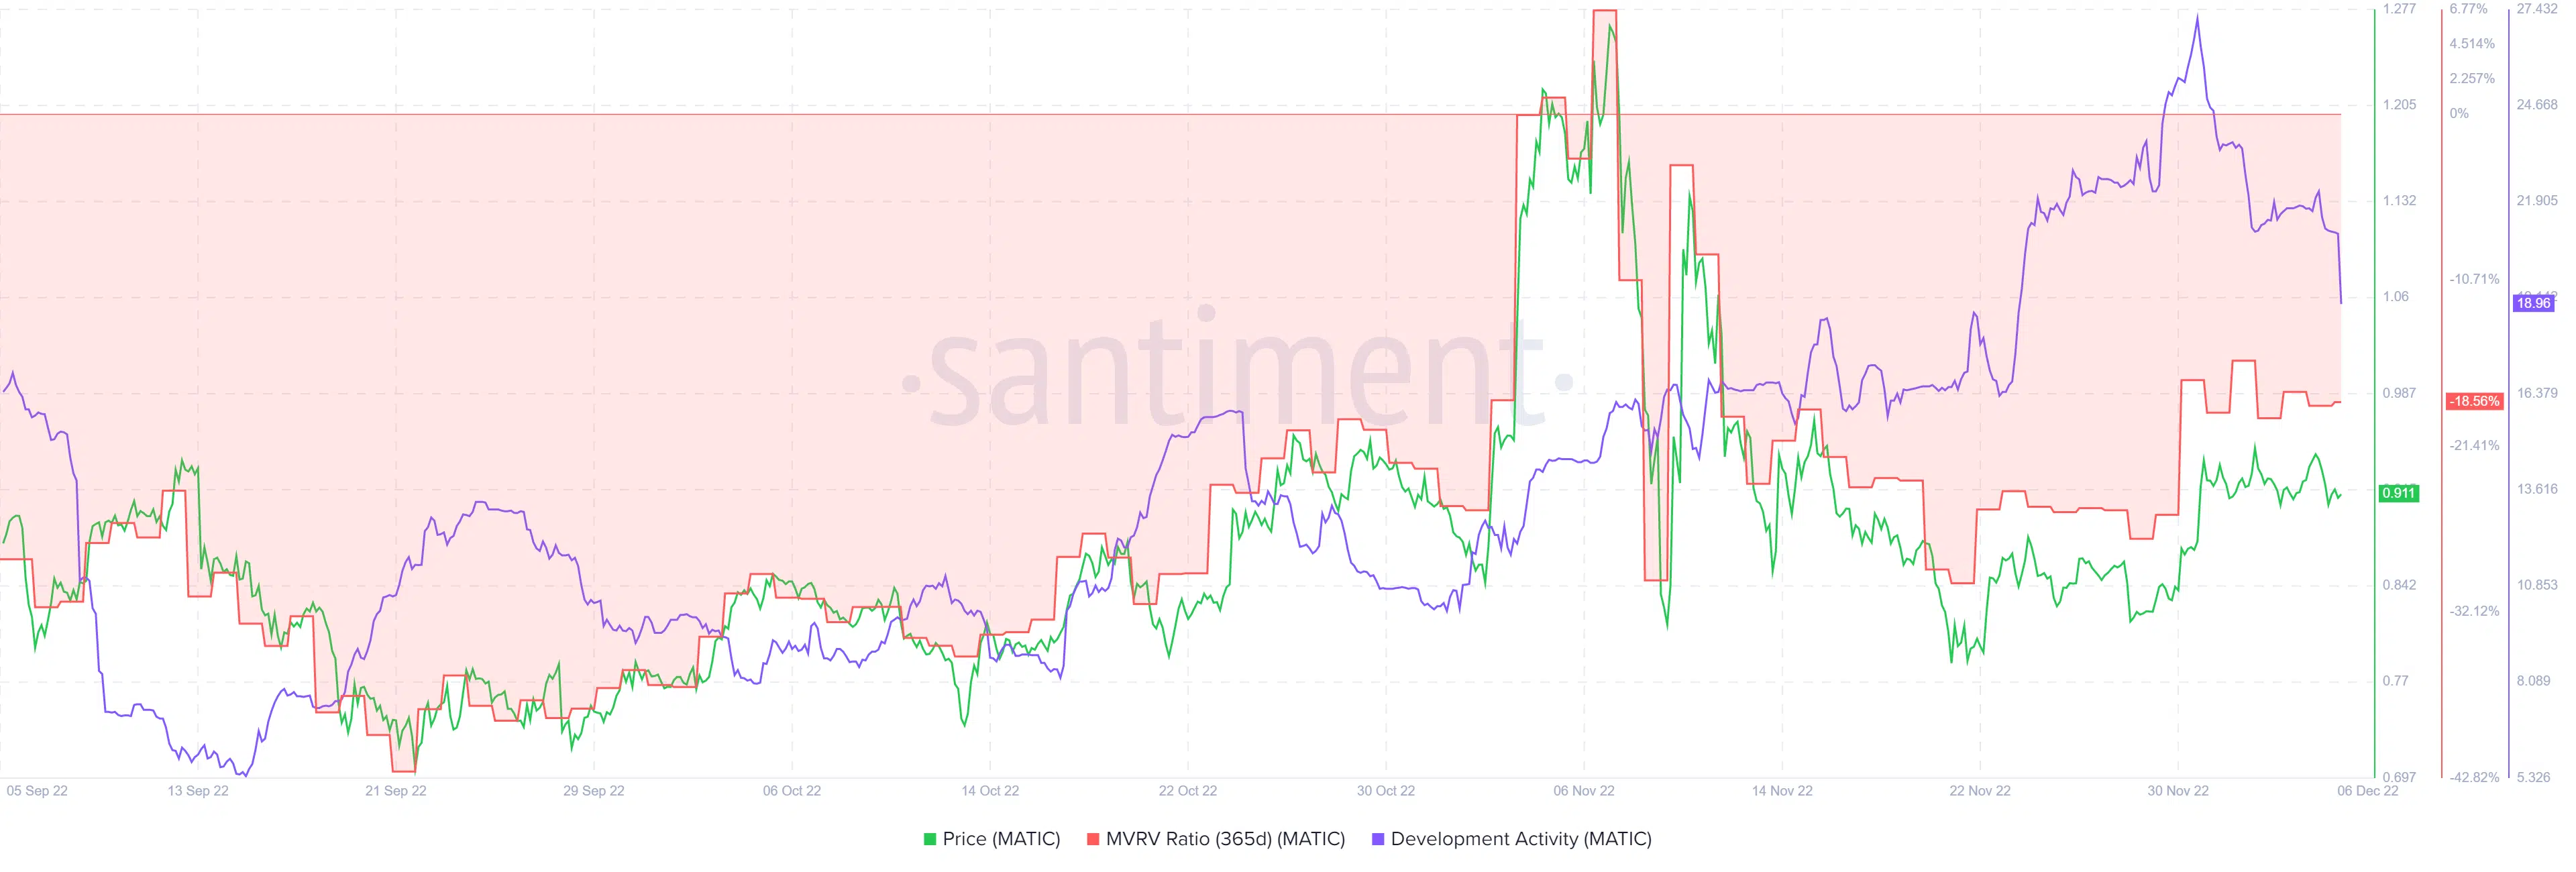
Source: Santiment
The MVRV ratio (365-day) briefly surfaced into positive territory early in November but was beaten back down. This showed heavy profit taking last month. At the time of writing, the MVRV saw a sharp slump once more.
In the meantime, the development activity was going strong. This showed long-term investors that developers went about their business without any regard for the price action, which was a heartening finding.