MATIC: Should you expect a 36% upswing thanks to these chart formations

MATIC’s price, at press time, highlighted a bullish setup in play, one that is nearing its breakout point. Investors can expect a breakout from this technical formation to result in exponential gains. On-chain metrics seemed to be both leaning bullish, but also adding a tailwind to the optimistic outlook.
A perfect confluence
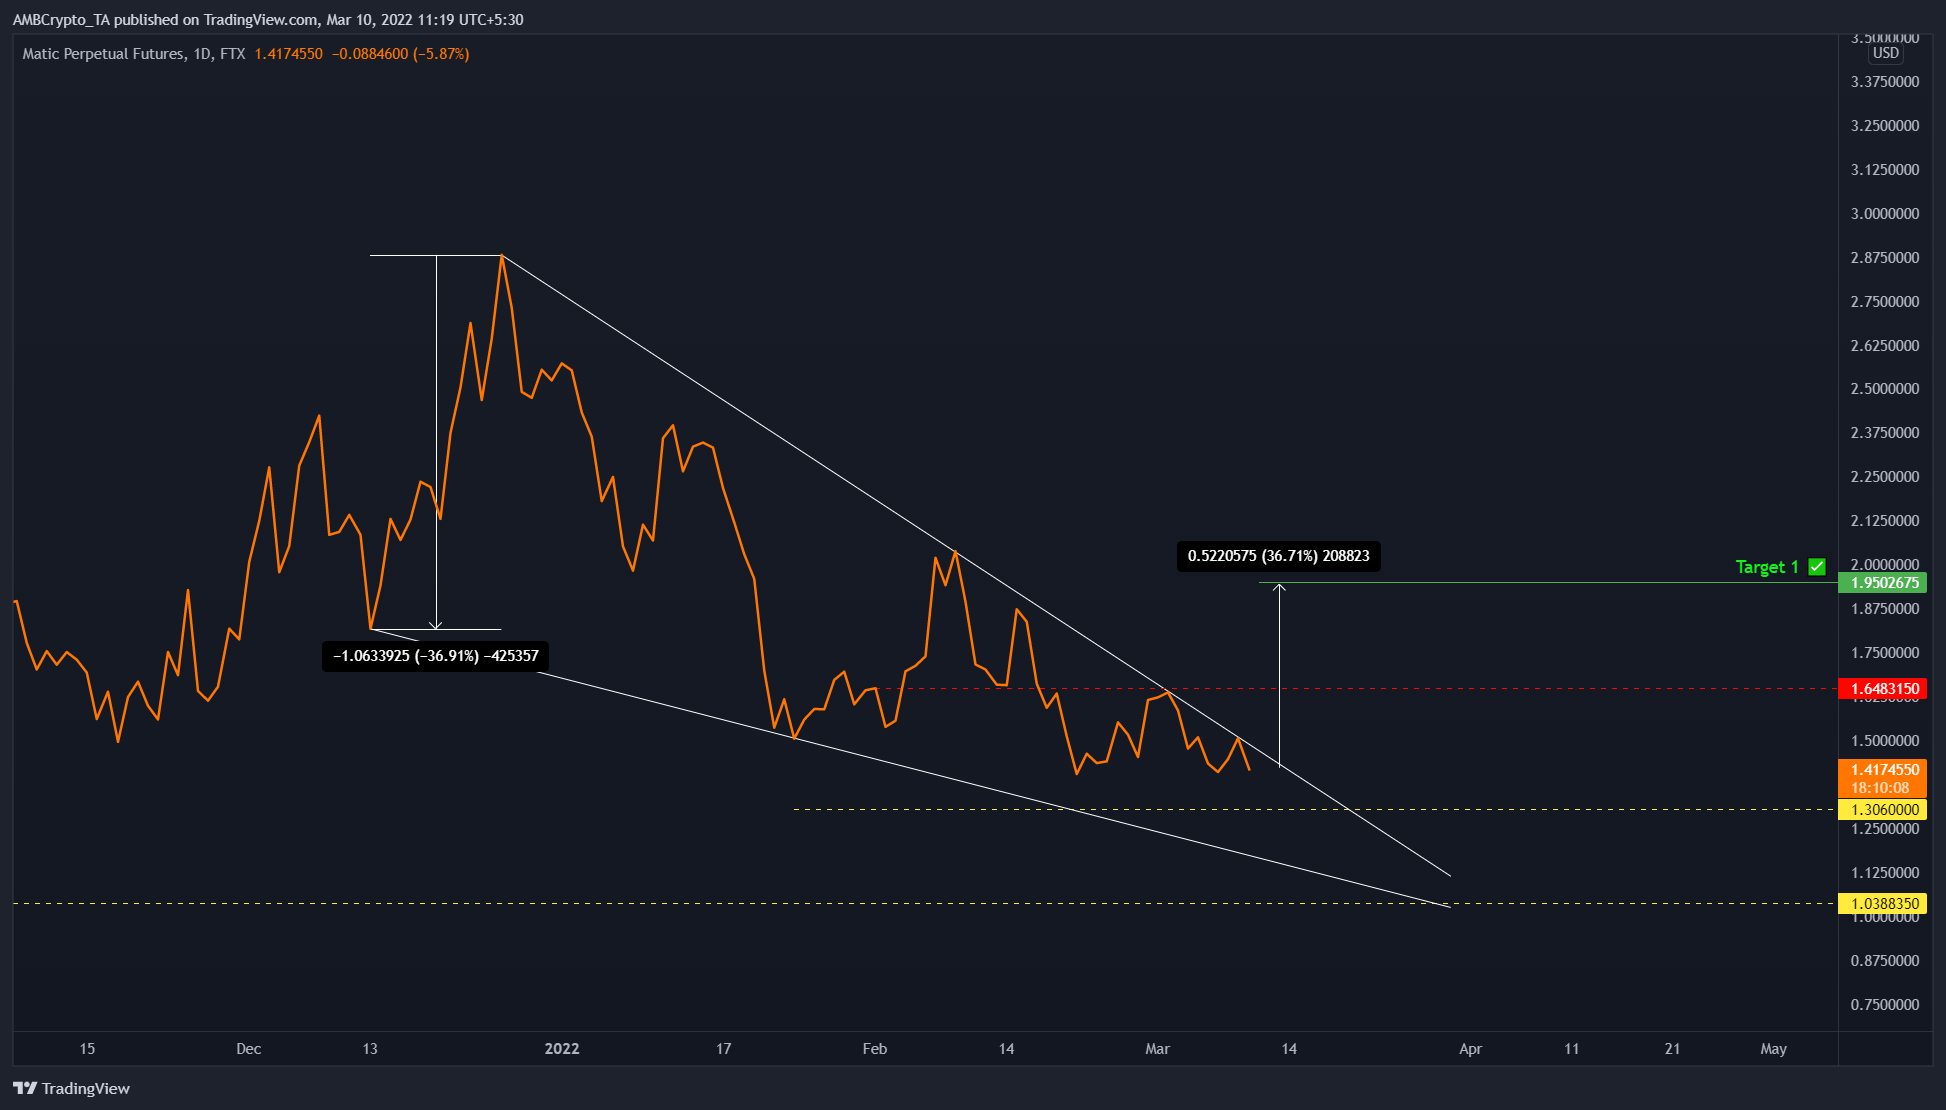
From 23 December 2021 to 10 March 2022, MATIC’s price set up four lower highs and two higher lows. Connecting these swing points using trend lines revealed a falling wedge formation.
This technical formation forecasts a 36% upswing to $1.95, a level obtained by adding the distance between the first swing high and low to the breakout point at $1.43.
As MATIC’s price continues to get squeezed between these two trendlines, investors can expect a massive breakout gushing with volatility. The $1.31-support level is the immediate barrier that will prevent a steep move lower, so a bounce off this foothold will be vital in triggering a decisive close above $1.43. This breakout will mark the start of an uptrend and propel the altcoin to $1.65 after a 16% rally.
While there is a chance the upside will be capped for MATIC at around $1.65, a resurgence of buying pressure will most likely extend the run to $1.95, bringing the total ascent to 36%.
The metric side of things
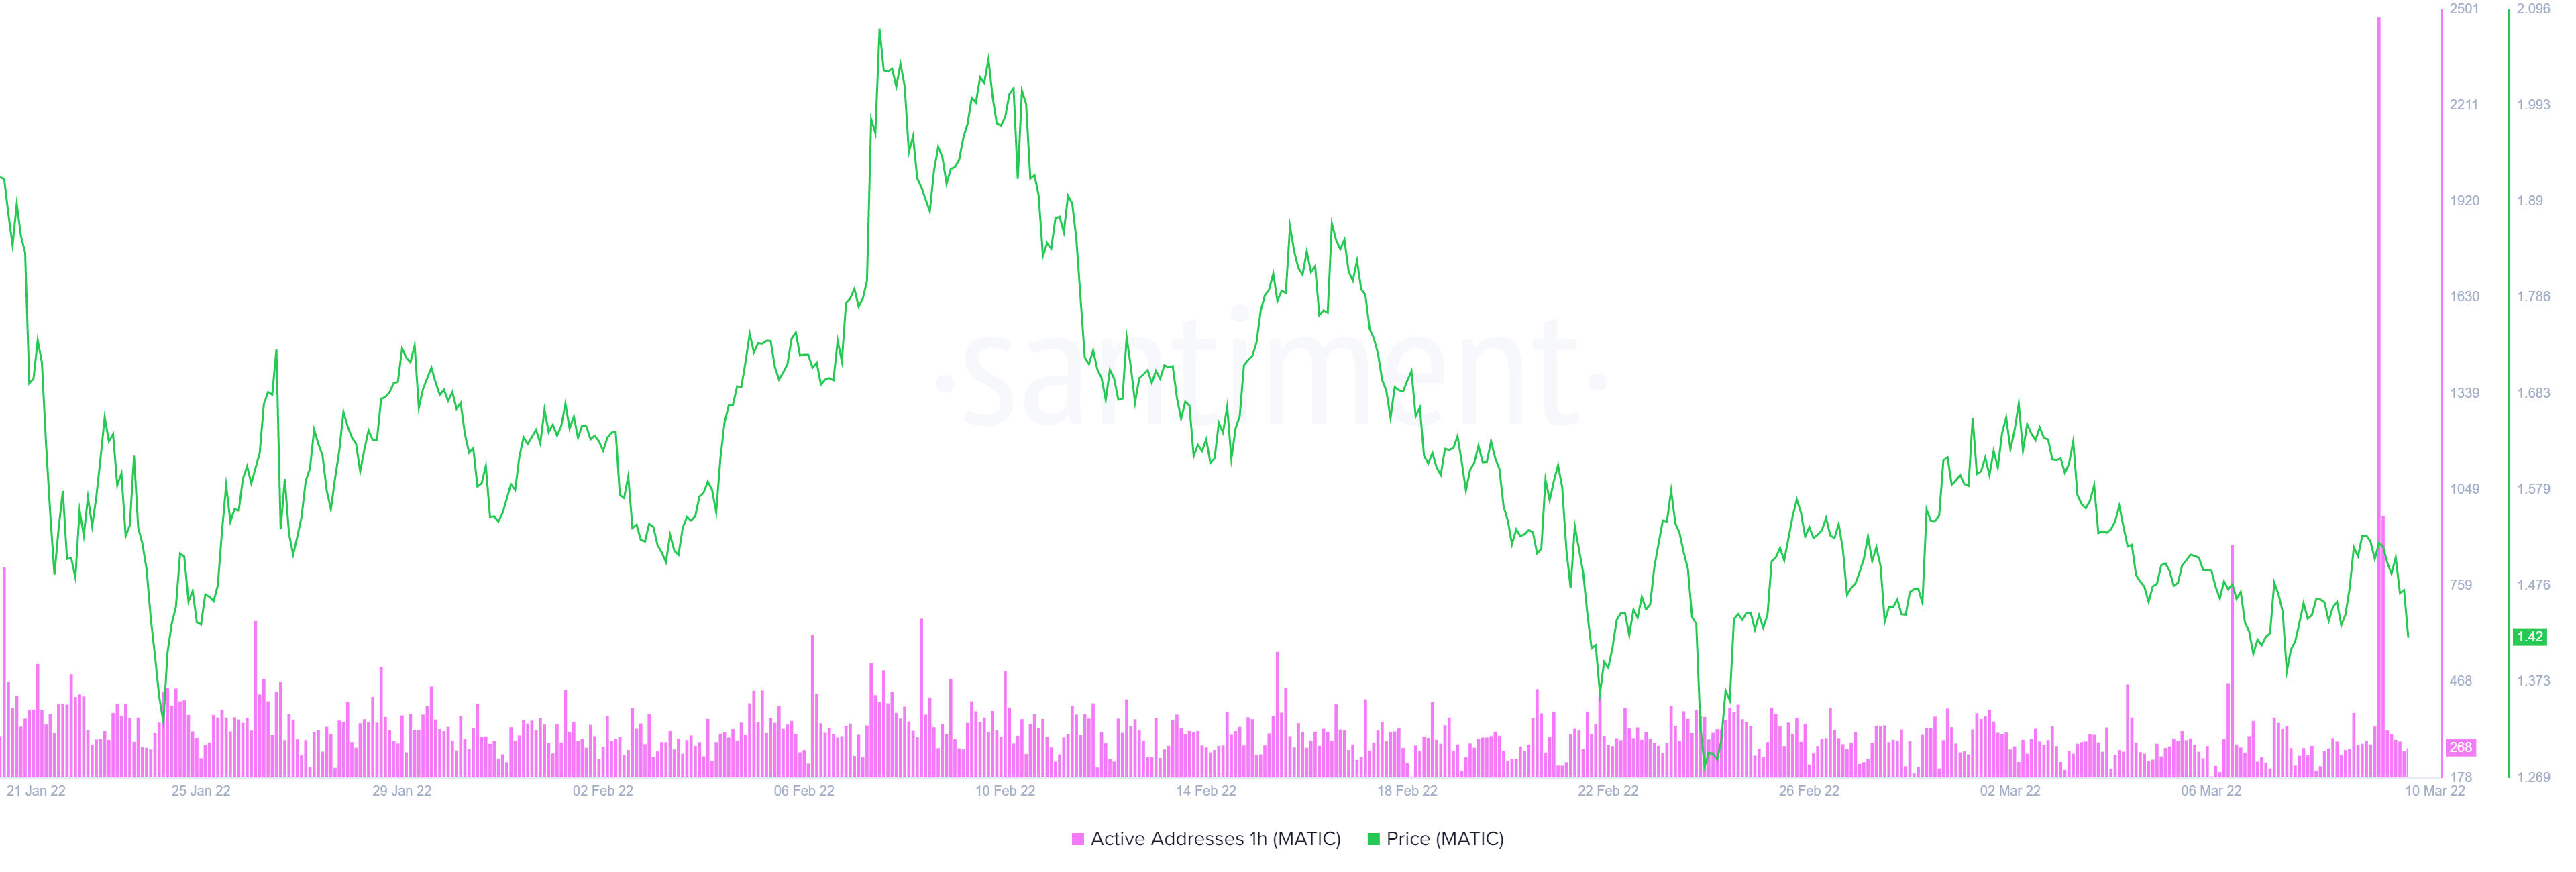
The 1-hour active addresses show the most recent activity of investors and could serve as a reliable signal for trading when combined with other technicals. For MATIC, this indicator has seen an explosive uptick from roughly 300 to 2755 on 9 March.
This spike suggests that investors are interested in MATIC at its current price levels. Considering the tightening of the price range inside the falling wedge, investors need to pay close attention to the crypto.
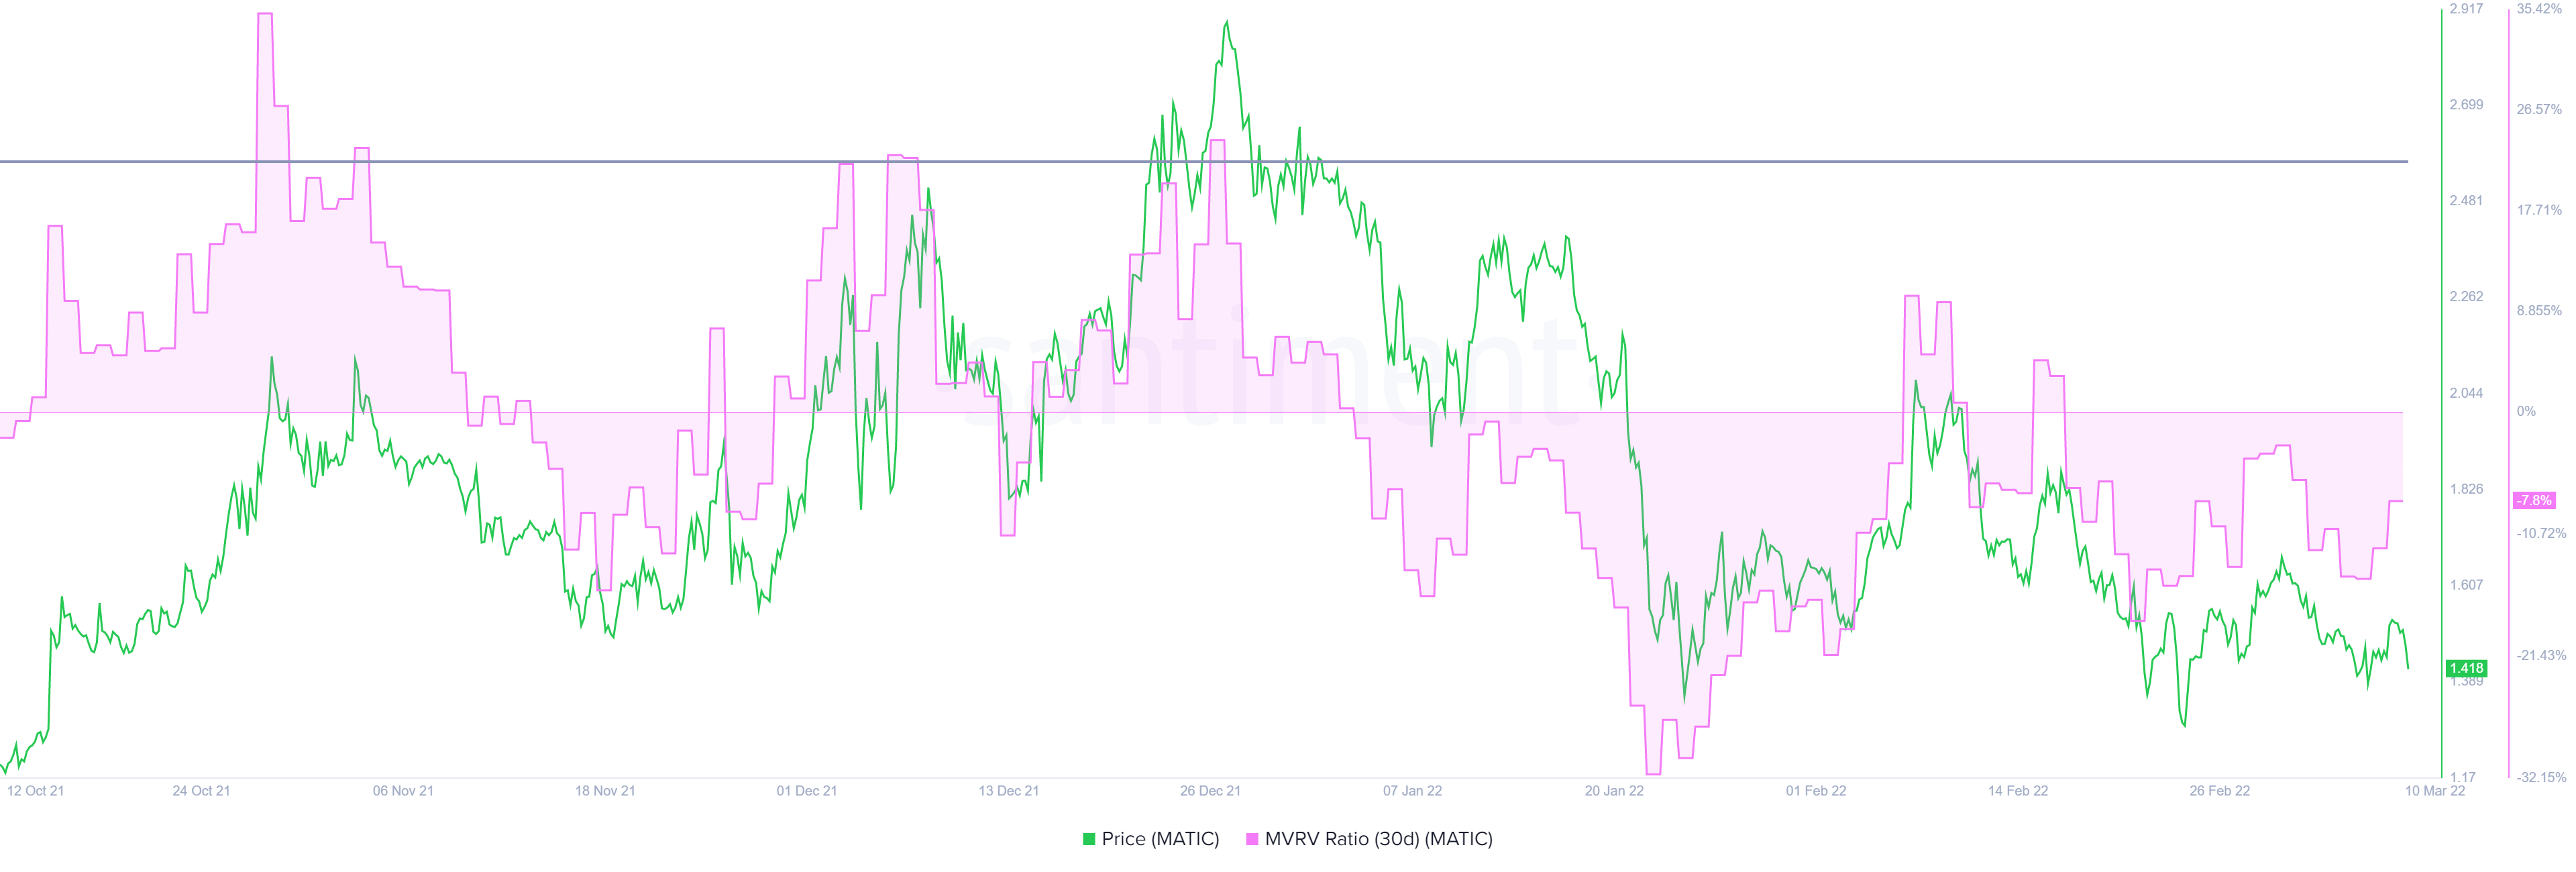
Perhaps, the most important on-chain metric that underlines the nature of bullishness is the 30-day Market Value to Realized Value (MVRV) model. This indicator is used to assess the average profit/loss of investors who purchased MATIC tokens over the past month.
At the time of writing, the 30-day MVRV was recovering from -14% to -7%, suggesting that fewer investors are spending time underwater. However, a value below -10% indicates that short-term holders are at a loss and is typically where long-term holders tend to accumulate.
Moreover, the upside potential for the emerging rally can also be gauged using this metric by observing the recent history of reversal. MATIC has reversed its uptrend multiple times whenever the on-chain index hit roughly 22%.
Considering the current position and the bullish indications from the technicals, there is a good chance MATIC’s price is due for an explosive move. Interested investors can start tracking for a breakout to take advantage of the incoming bull rally.


![Uniswap [UNI] price prediction - Traders, expect THIS after altcoin's 14% hike!](https://ambcrypto.com/wp-content/uploads/2024/12/UNI-1-400x240.webp)

