MATIC’s revisit to this area can be a good buying opportunity

Disclaimer: The findings of the following analysis are the sole opinions of the writer and should not be considered investment advice.
Ethereum has been on fire on the price charts over the past week as the asset gained nearly 50% within six days. This bullish momentum translated well to many altcoins on the market.
Last week, the Walt Disney Co. announced that Polygon had been chosen for a business development accelerator program. Since then, MATIC posted gains of close to 70% and had solid bullish momentum. How much further can the coin climb?
MATIC- 12-Hour Chart
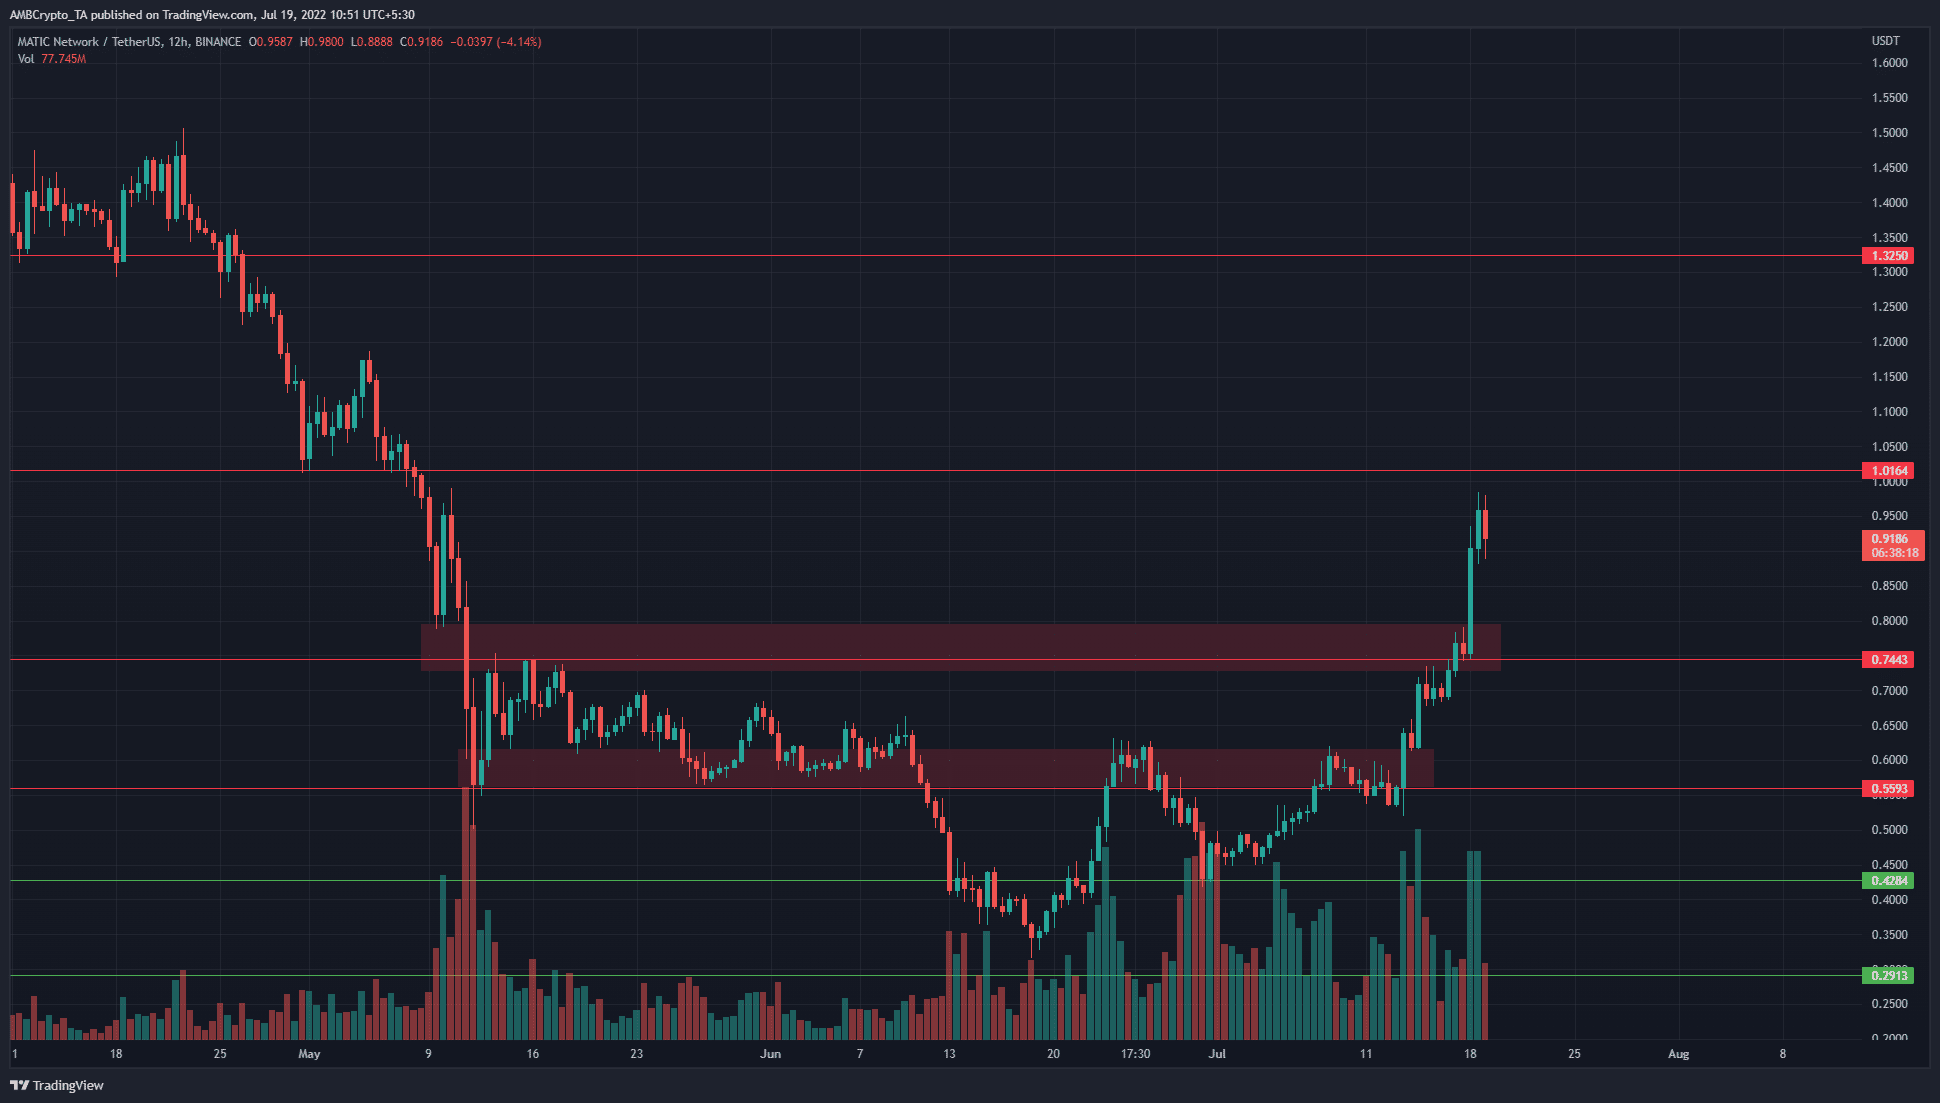
On the 12-hour chart, it can be seen that MATIC was in a strong downtrend coming into May and June. This downtrend began in mid-January. The price set a series of lower highs since then, characteristic of a downtrend.
Since May, there have been two zones of stiff resistance that were crucial for the bulls to break past. These lay at the $0.55-$0.6 zone, and the $0.72-$0.8 zone.
Over the past month, MATIC has actually posted higher lows and breached the previous lower high as well. Last week, the longer-term bias flipped to bullish for MATIC after the move above $0.6.
At the time of writing, the $0.95-$1 area opposed further gains. The $0.8 area would likely be a demand zone in the weeks to come. Lower timeframe traders would focus on the $0.86-$0.88 area for the bulls to defend.
Rationale
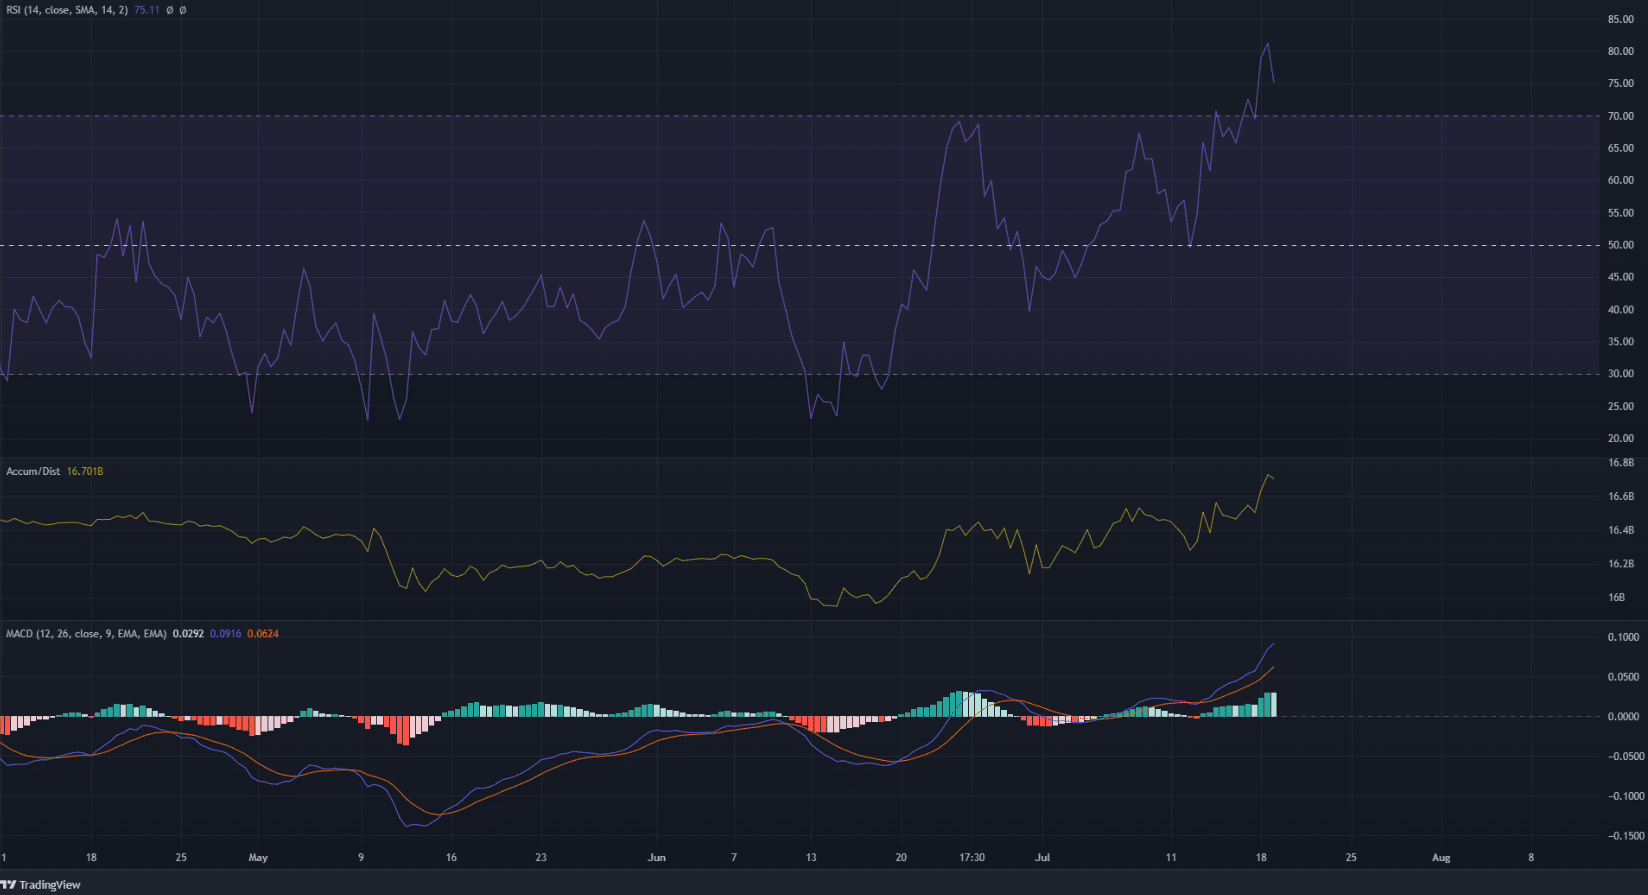
The RSI has been above neutral 50 for the better part of the past month, with a brief dip to 40. This showed that market participants had a high conviction of a move upward in the past couple of weeks.
The A/D line also climbed alongside the price. This showed significant demand behind the rally. This was also one of the key indications that there was further upside left for MATIC. The MACD also signaled strong bullish momentum as it climbed past the zero line.
Conclusion
The Disney announcement last week meant that the long trade was slightly overcrowded. The long/short ratio on FTX for MATIC was at 62% according to Coinglass.
A revisit to the $0.86-$0.9 area can be used to buy the asset, and target $1.05 and $1.2 provided Bitcoin also maintained a bullish bias.


