Memecore reclaims $1, but these factors may cap the rally
The $1.20-$1.30 supply zone had been a critical support earlier in the year, and was now a key resistance.

Memecore [M] has rallied 54% in 24 hours and was back above the $1 psychological level. It also brought the memecoin’s market cap back above the $1 billion mark, taking it as high as $1.47 billion at the time of writing.
This has helped the overall memecoin sector performance, but it was still underperforming Bitcoin [BTC], with 8.9% sector-wide market cap shed compared to BTC’s 2.9%.
Crypto market participants remain skeptical of the Memecore price action, questioning how such a large market cap token has such thin liquidity on the books. The severe 1-day correction of over 80% last week occurred on only $21 million in trading volume.
It had no clear catalysts, such as a hack or exploit of some sort. Crypto sleuth ZachXBT had publicly questioned M’s supply distribution in April, alleging insider manipulation as the reason behind such elevated valuations.
With a major sell-off over, does Memecore have a chance at recovery?
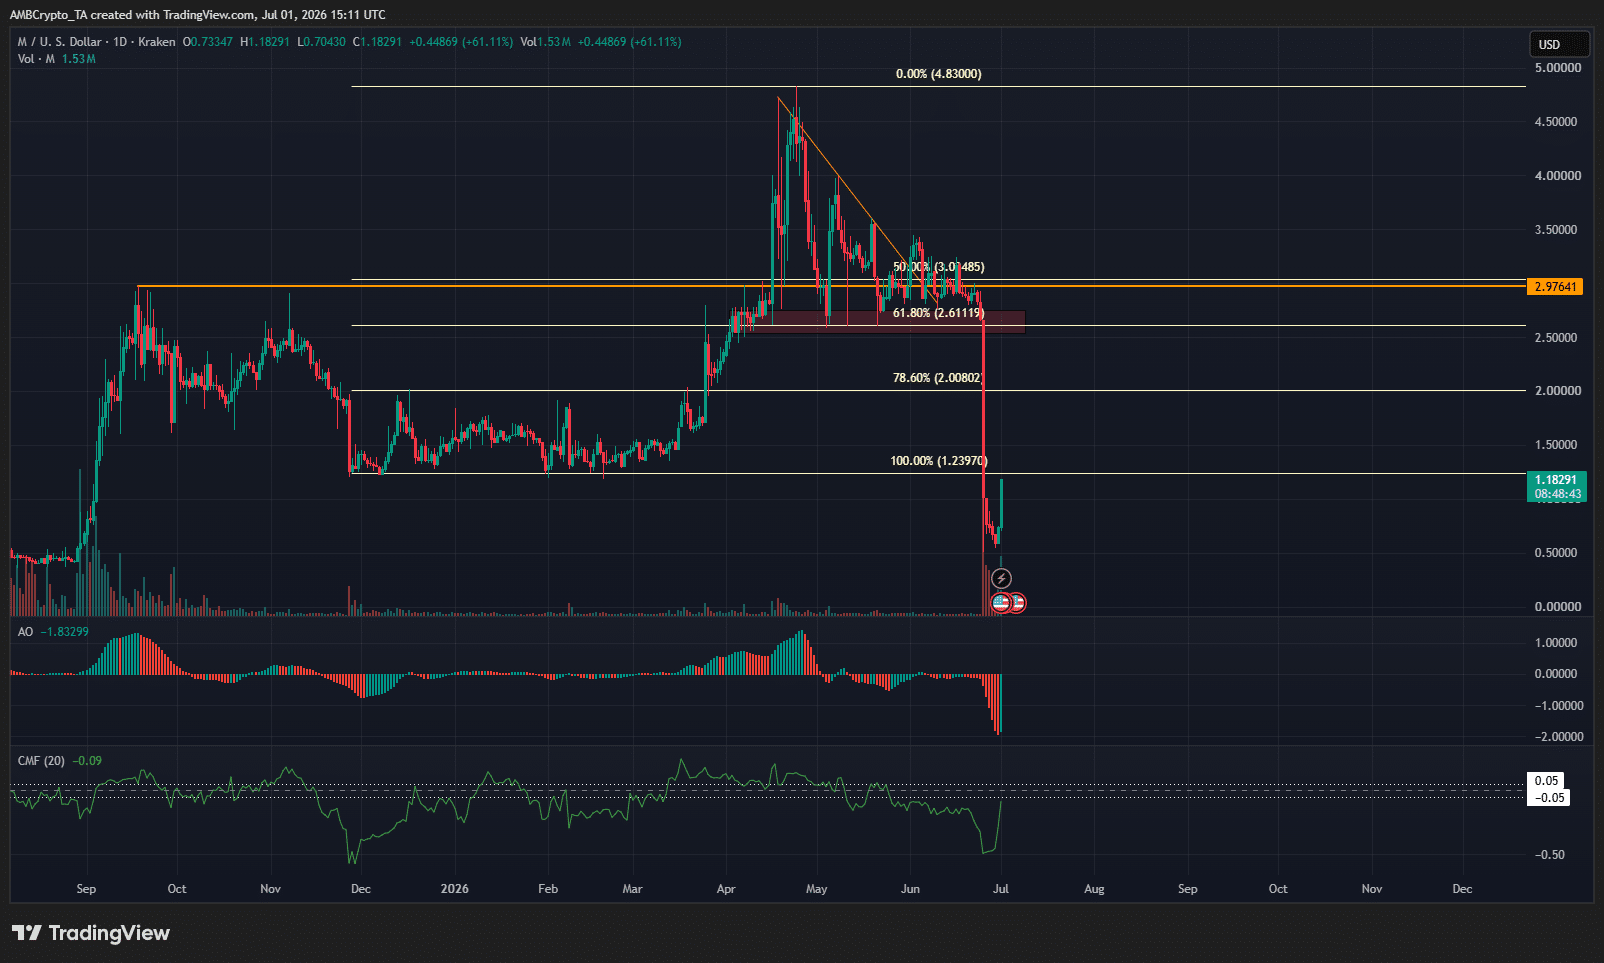
The 1-day timeframe’s price action was bearish, no doubt. The $4.83 swing high made in April originated from the $1.20 launchpad, which was decisively breached during last week’s thin liquidity selling.
The Awesome Oscillator was well below the zero line to showcase the extreme bearish momentum. The CMF has climbed from -0.49 to -0.09, which was still below the -0.05 threshold that indicates sizeable capital outflows.
Though the altcoin was back above the $1 round-number resistance, the $1.20-$1.30 area remained a hefty bearish barrier.
Memecore token prices retested this demand zone numerous times from November 2025 to February 2026, establishing it as a key higher timeframe horizontal zone.
Traders’ call to action- Do not buy
The market manipulation accusations and wildly irregular price action recently meant even the most staunch long-term holders’ conviction in M would have been shaken.
Though the token has rallied considerably in the past 24 hours, it remained under duress from sellers.
It might be risky, but speculative traders may view the $1.20-$1.30 zone as a potential area to monitor for renewed selling pressure. More risk-averse traders can stay sidelined altogether, as it might be the safest play in a highly volatile M environment.
Final Summary
- The Memecore price action was extremely volatile, and swing traders have reason to stay sidelined or bearish instead of trying to buy the bounce.
- The $1.20-$1.30 supply zone had been a critical support earlier in the year, and now could be tested before the next bearish price leg commences.