Polkadot
Mixed signals in DOT market: What’s next for Polkadot prices?
Here’s why DOT’s fall might come to a halt soon.

- DOT’s price faces a key threshold; if it can break through the current supply level, a rally could follow.
- Technical indicators are sending mixed signals—some suggest a bullish shift, while others hint at continued bearish pressure.
Over the past month, Polkadot’s [DOT] performance has been lackluster, with a dominant bearish sentiment leading to an 18.97% decline.
The next move for DOT remains uncertain as conflicting metrics keep market sentiment divided, leaving room for volatility across upcoming trading sessions.
DOT stuck between key levels
DOT is currently trading between two significant levels that could shape its direction in the upcoming sessions.
After recently bouncing off a support level at 3.959, DOT could rally to 4.615 or 4.964 if this support holds. However, a supply zone lies directly above, which could trigger selling pressure and push the price lower, potentially returning DOT to its August low.
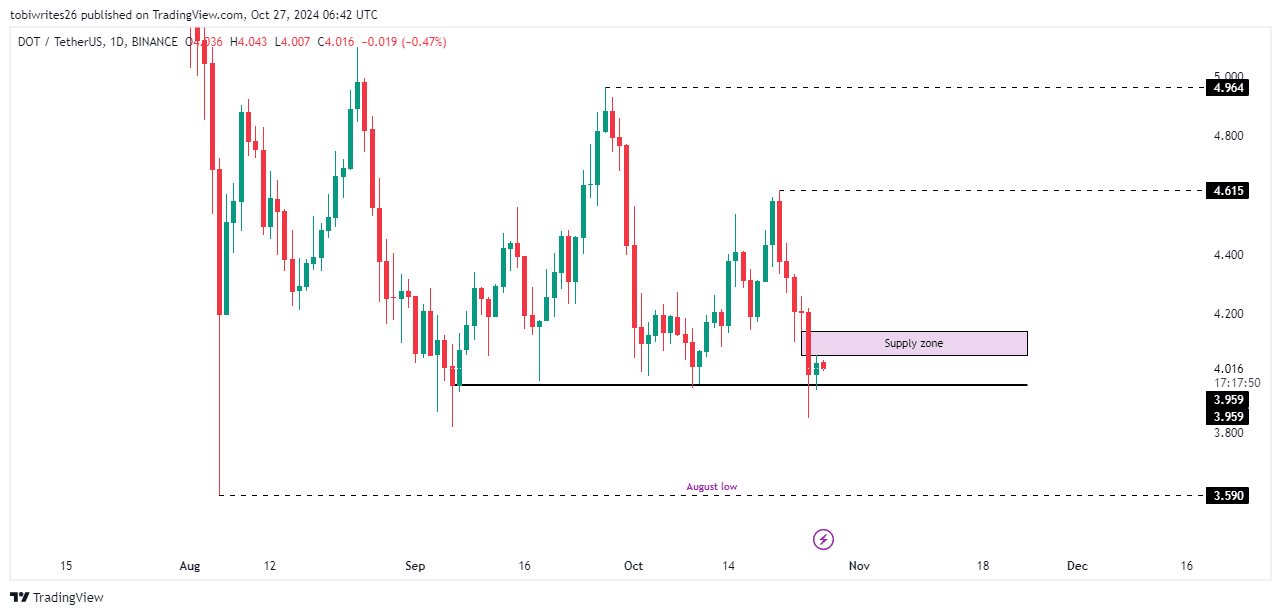
Source: Trading View
To assess the potential movement, AMBCrypto analyzed technical indicators, but found mixed signals, leaving the outlook uncertain.
No clear pattern from traders: mixed signals for DOT
Two major indicators, the Chaikin Money Flow (CMF) and Parabolic SAR (Stop and Reverse), present a blend of bullish and bearish signals for DOT, leaving its future direction uncertain.
The Chaikin Money Flow (CMF), which assesses the flow of liquidity into or out of an asset, has shown an uptick, with a current reading of 0.11. A positive CMF value suggests increasing buying pressure, which typically aligns with a potential upward price movement for DOT.
This reading indicates that if this momentum continues, DOT could push through its current supply zone, potentially sustaining a rally.
Conversely, the Parabolic SAR, a trend-following indicator that signals reversals, displays a bearish sentiment. This is indicated by multiple dots above DOT’s price, suggesting ongoing selling pressure and a likely continuation of the downtrend.
When the Parabolic SAR dots appear above the asset’s price, it signals resistance and the potential for further price declines.
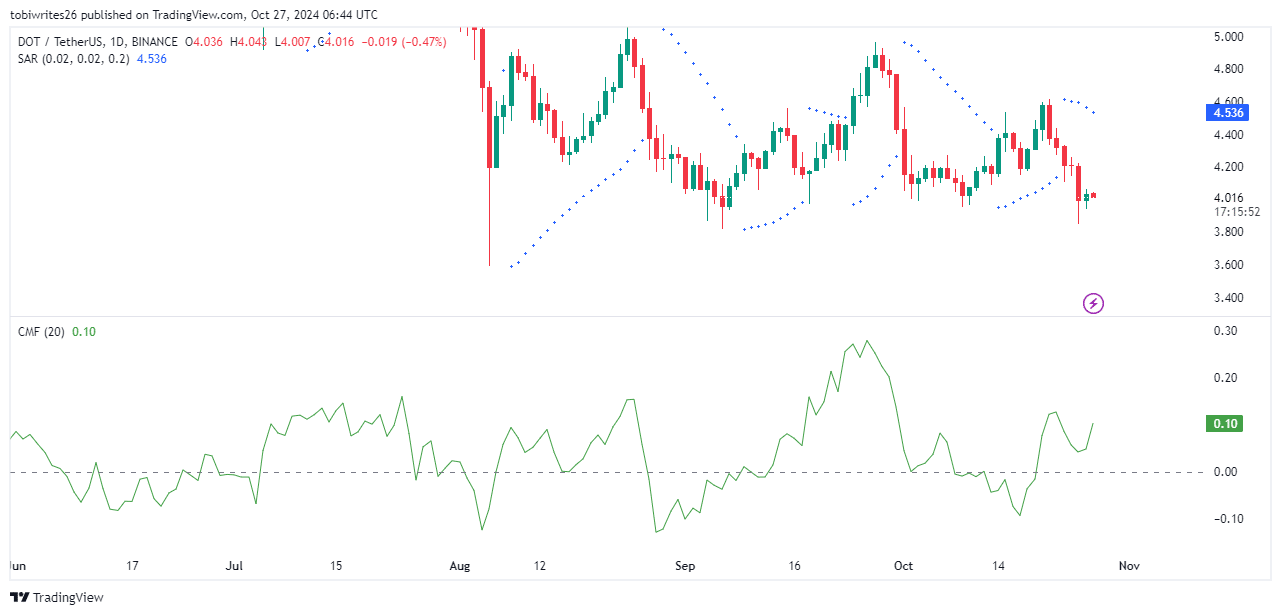
Source: Trading View
With these two indicators suggesting opposing trends, AMBCrypto turned to on-chain activity to provide additional insights into DOT’s next move.
Gradual buying pressure emerges for Polkadot
Data from Coinglass indicates a positive funding rate for DOT, suggesting an increase in long interest from traders.As of the latest reading, DOT’s funding rate stands at 0.0109%.
Read Polkadot’s [DOT] Price Prediction 2024-25
A positive funding rate means that traders holding long positions are paying those holding short positions to maintain price equilibrium. This trend typically points to an underlying bullish sentiment, as more traders are betting on price increases, which could push DOT higher.
If this buying pressure continues, DOT may break through its current supply zone and trend further upward.