Mog coin rises 12% in 24 hours: Will profit-taking hold it back now?
The short-term liquidation heatmap favored continued gains. The $0.00000206-$0.00000214 region is the next magnetic zone.

- Mog coin continued to trade within a five-month range.
- A range breakout is not expected soon.
Mog coin [MOG] had a bullish October. It recovered from the five-month range lows in September and flipped the mid-range level to support in early October. The meme coin is up 19.3% since the lows of Saturday, October 26th.
Mog coin is just 22% below its ATH, and Bitcoin [BTC] is just 3.6% away. Could this bullish wave push the meme coin beyond the range highs?
Range formation for MOG
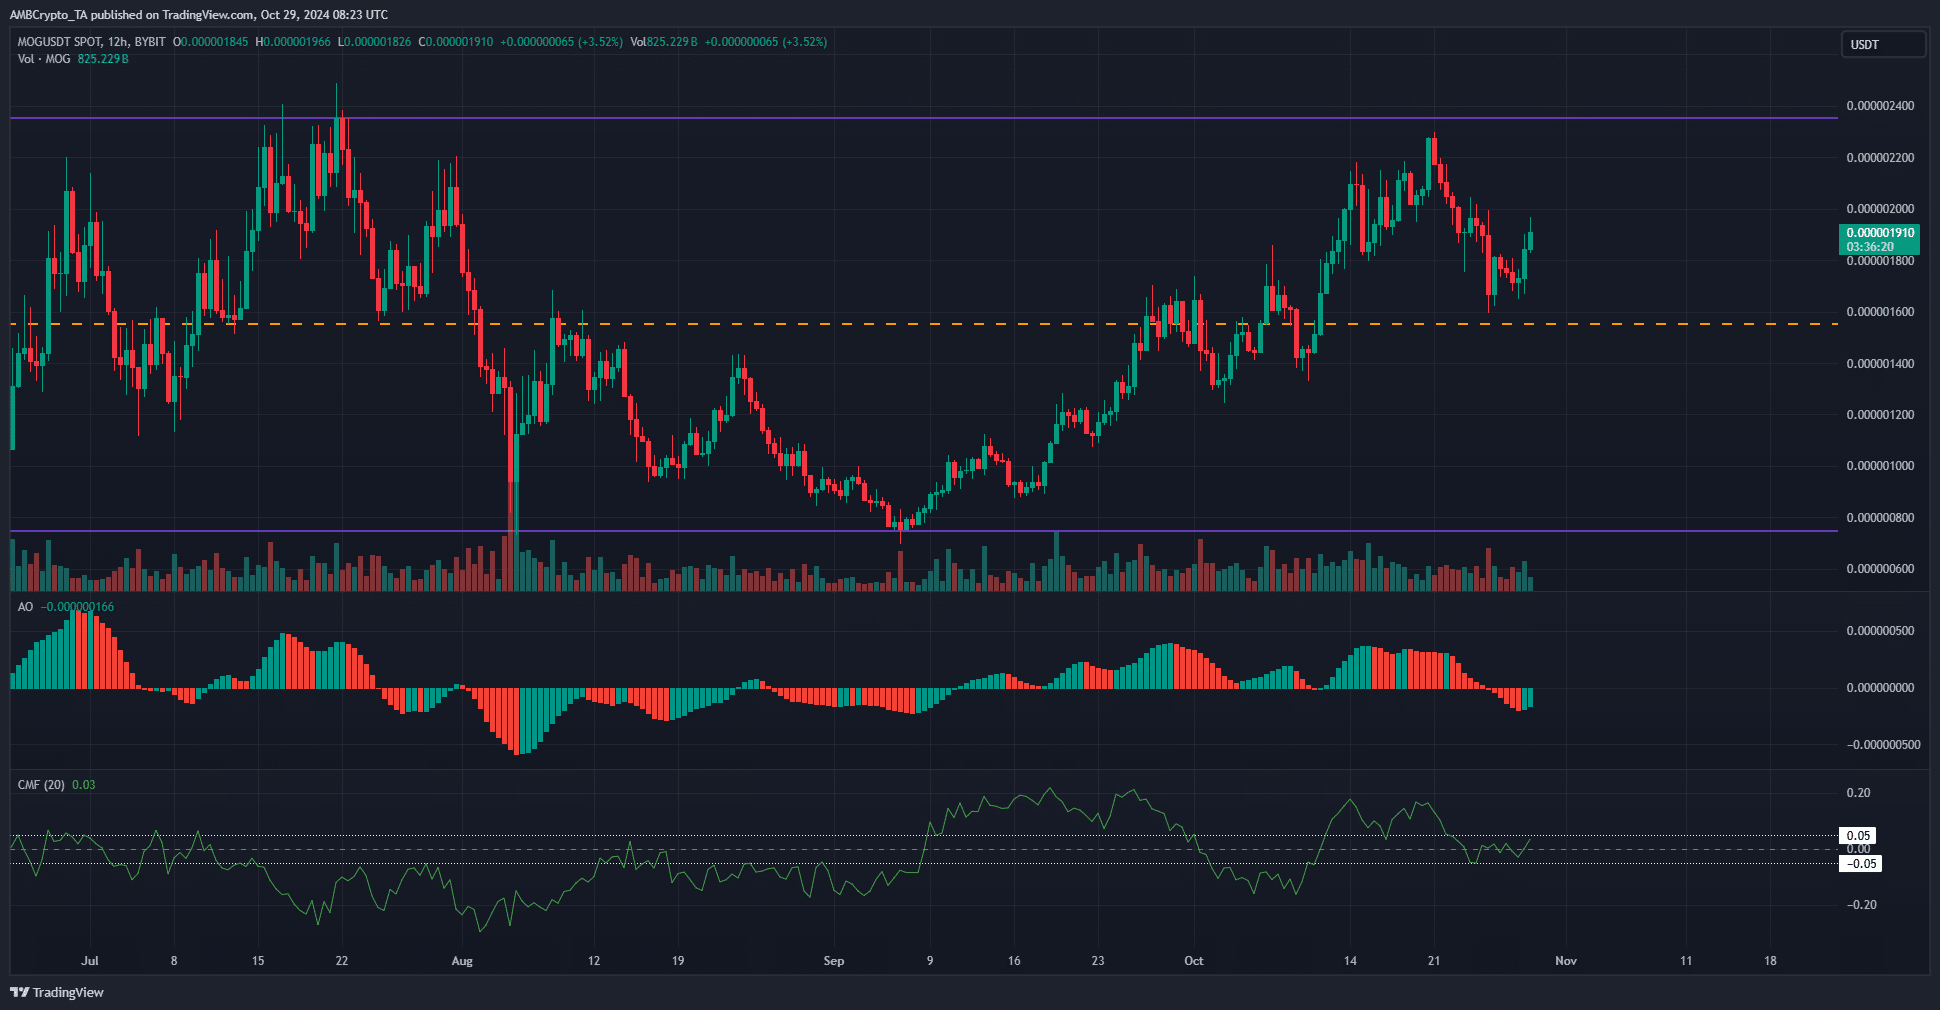
Mog Coin has traded within a range that reached from $0.00000075 to $0.00000236 since June. Despite the strong gains in October, the range formation has not yet been broken.
The mid-range level at $0.00000155 was almost retested as support last weekend. Since then the meme coin has rallied by over 15%. Yet, on the 12-hour chart, the Awesome Oscillator remained below the zero mark.
This showed that momentum was still in favor of the bears. Similarly, the CMF was unable to push beyond the +0.05 level to signal strong capital inflows to the market.
The price action revealed that MOG was still in an uptrend. So long as the token remains above the mid-range support, a move toward the range highs is expected. However, a breakout is not imminent, and Bitcoin could affect MOG’s trend.
Arguments for bearish pressure
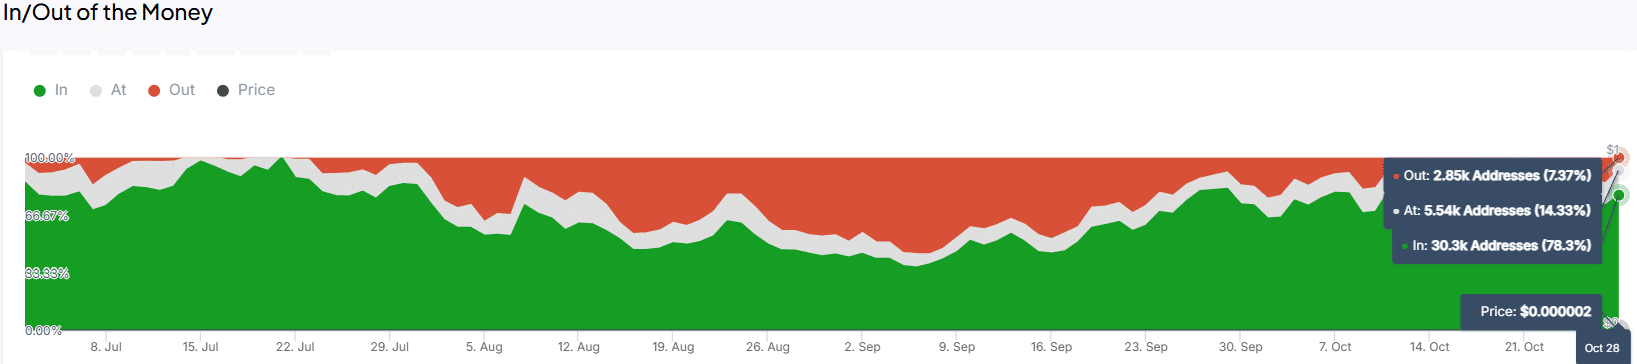
Data from IntoTheBlock showed that the in/out of the money showed a majority of the holders were in profit. As of the 28th of October, 78.3% of the addresses were in the money. This could lead to selling pressure from profit-taking.
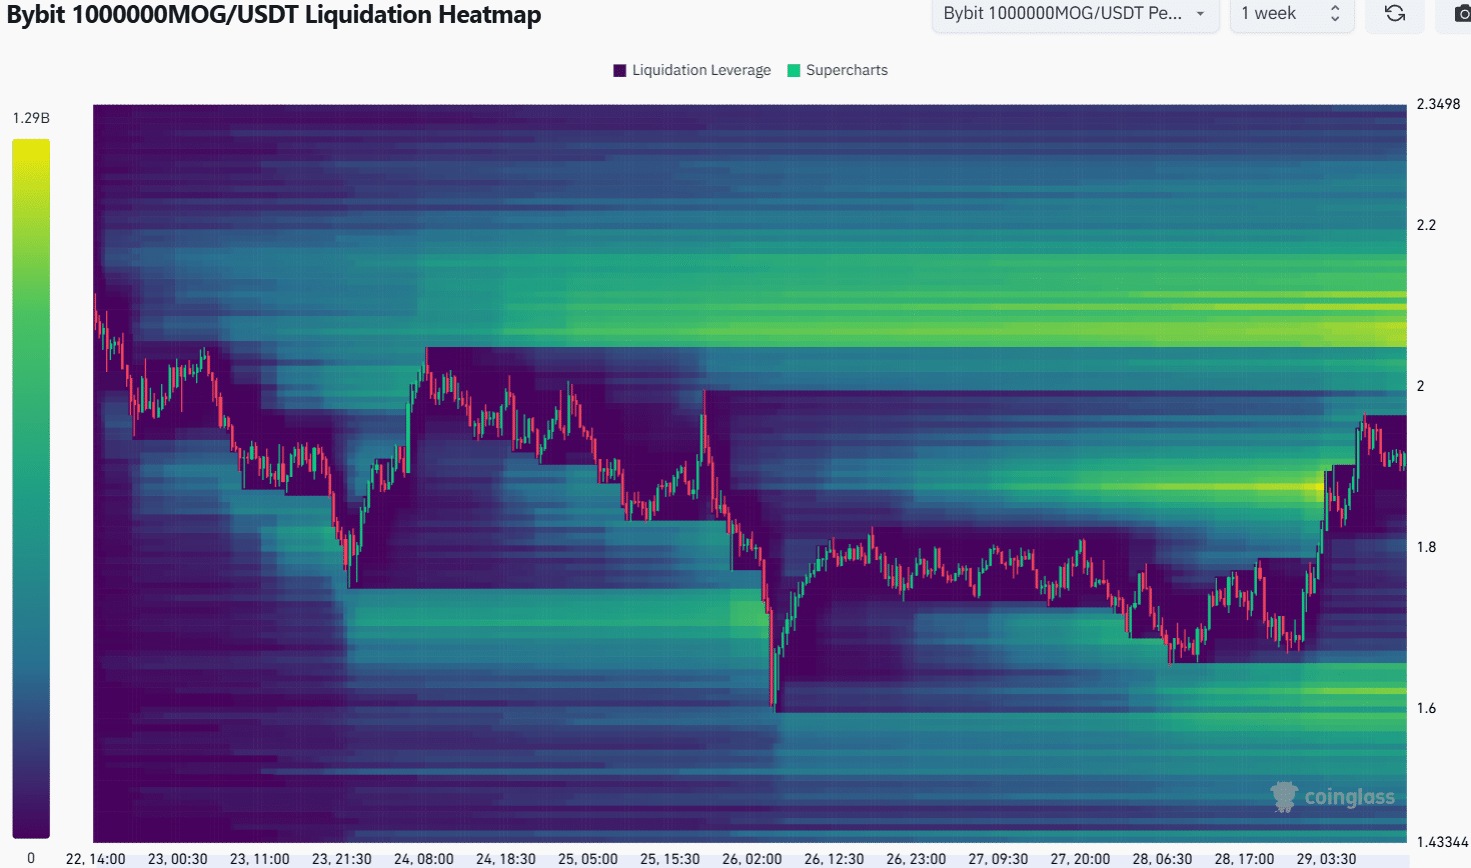
AMBCrypto found that the short-term liquidation heatmap favored continued gains. The $0.00000206-$0.00000214 region is the next magnetic zone. Further north, the range highs made the $0.0000023 area a firm resistance zone.
Realistic or not, here’s MOG’s market cap in BTC’s terms
This meant the outlined regions were prime candidates for a short squeeze followed by a bearish reversal. If the bulls are strong enough, a range breakout is possible, but as things stand, traders can look to take profits at $0.00000214 and $0.00000234.
Disclaimer: The information presented does not constitute financial, investment, trading, or other types of advice and is solely the writer’s opinion