Monero, Klaytn, Chainlink Price Analysis: 04 May

Monero needed to defend $388 from bearish pressure and this would lead to a breakout above $440. Klaytn’s recovery was restricted below $2.6, while Chainlink was projected to break north from its pattern and head towards $49.
Monero [XMR]
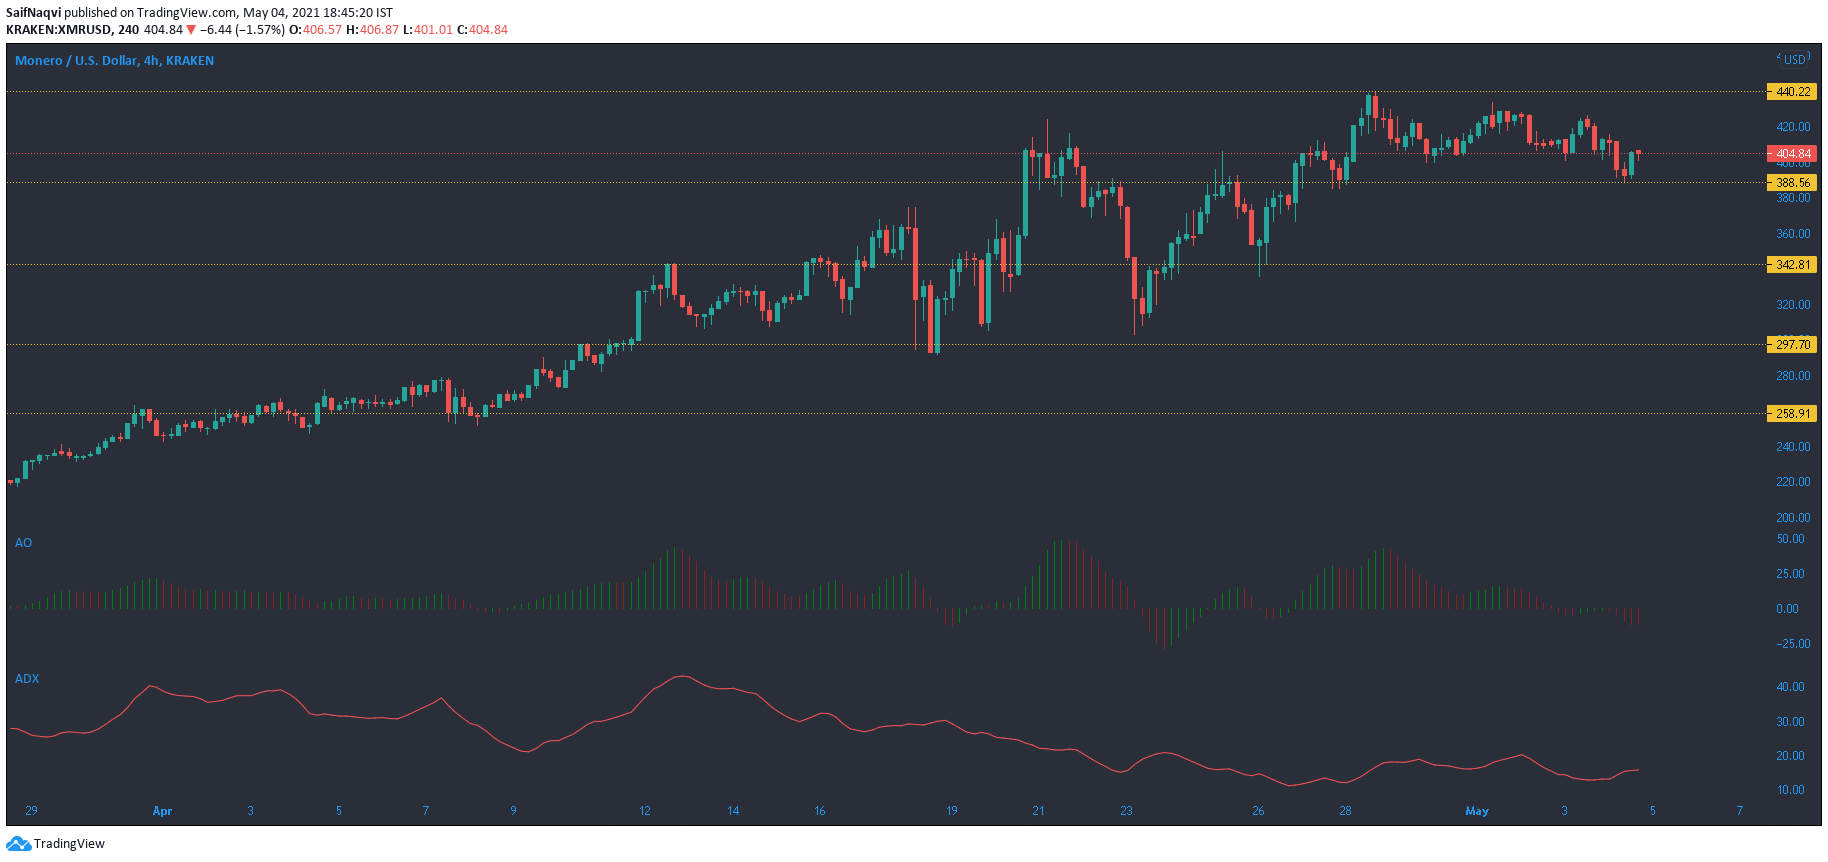
Since the last week of March, Monero has seen exponential growth. A low of $204 seen during March 25 and a high of $438 a week ago represented gains of over 110%. For the last few sessions, the rally was kept at bay under the $440-mark and some bearishness was noted in the market. According to Awesome Oscillator’s red bars, momentum was on the bearish side, but the hourly timeframe did see a positive switch up. A strong region of support lay at $388 and maintain this would allow for a breakout above $440.
Meanwhile, ADX rested at 15 and highlighted a weak trend. The 24-hour trading volumes jumped by 40% in the last 24-hours but were yet to touch $1 Billion. Expect some sideways movement before the volumes jump further.
Klaytn [KLAY]
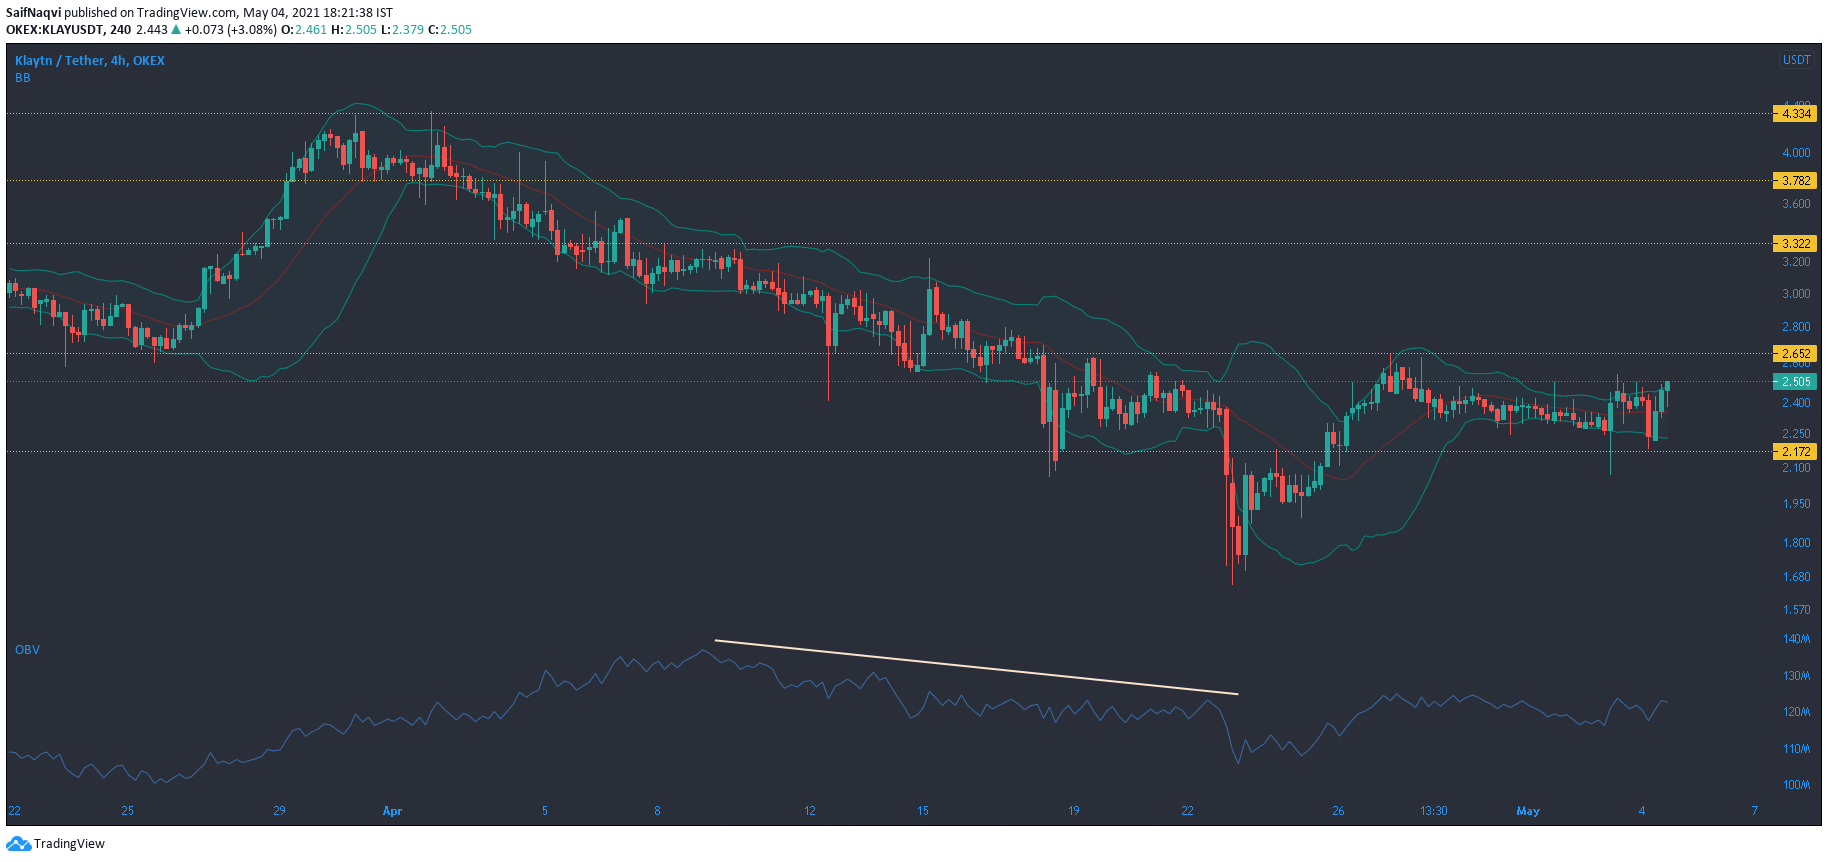
Since snapping an ATH slightly above $4, Kalytn showed a steady downtrend on the 4-hour timeframe. In fact, most profits made would have been through the way of shorting as the price dropped below multiple support levels. On Balance Volume made lower highs and lower highs as selling pressure was dominant during this period. Buyers finally stepped in at around $1.7, but recovery was limited to the upper ceiling at $2.6.
Bollinger Bands remained constricted and low volatility denied the possibility of sharp movements in the market over the short term. If the present support mark is maintained, KLAY would likely breach the $2.6-barrier.
Chainlink [LINK]
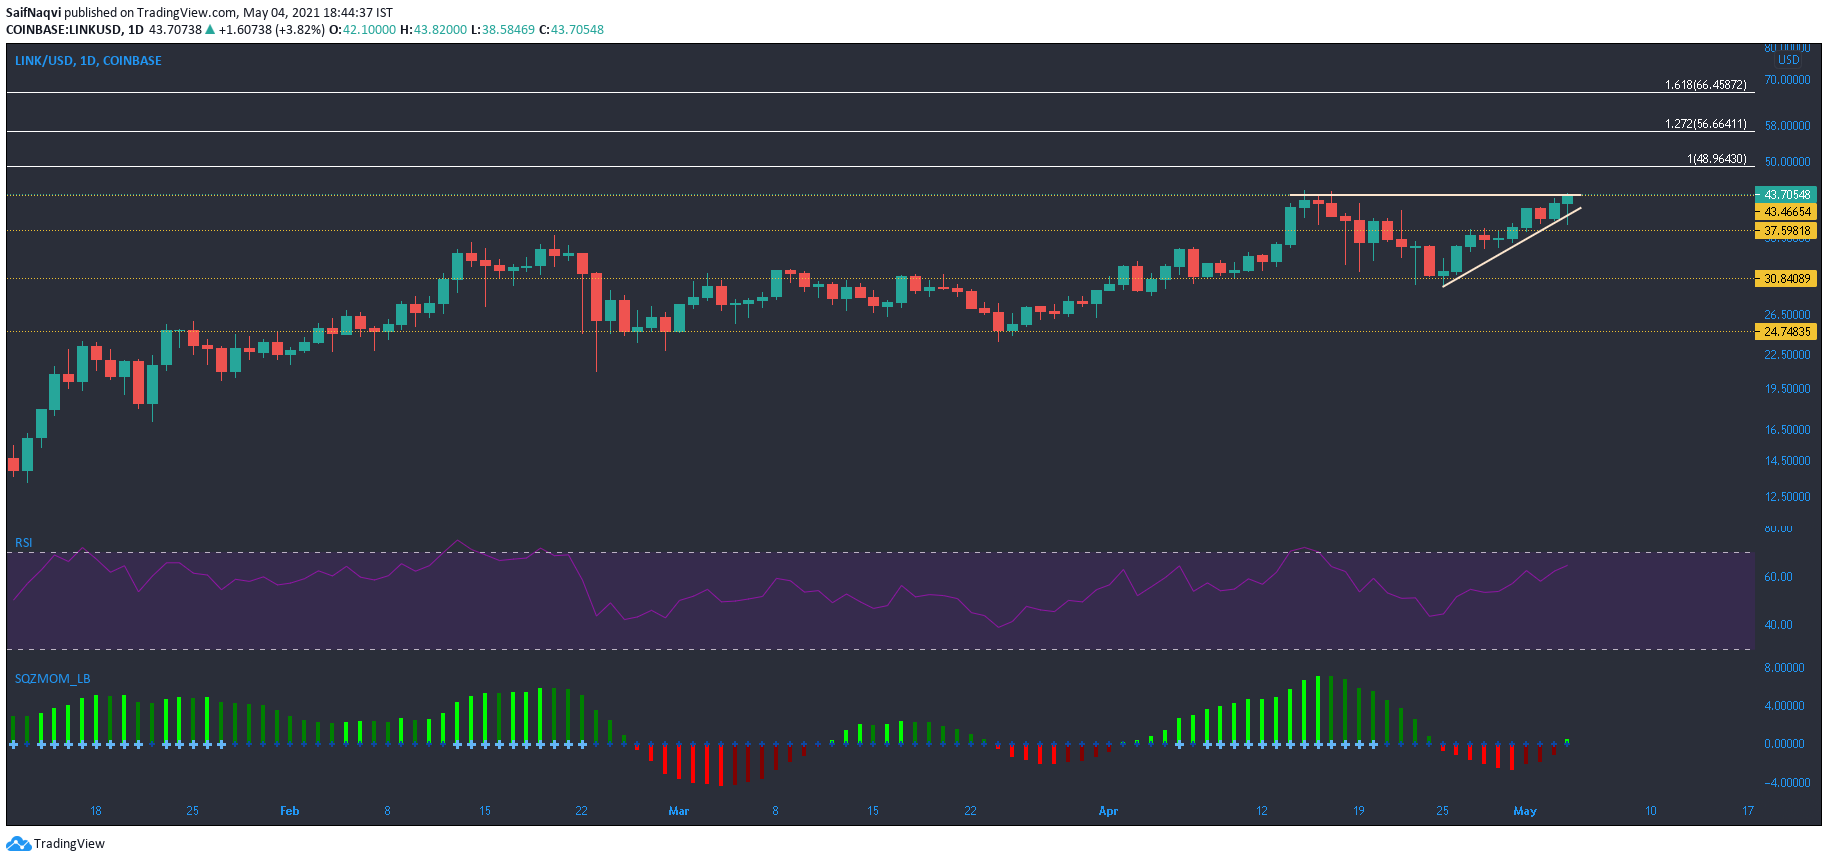
On the daily timeframe, Chainlink traded within an ascending triangle. The upper trendline lay around $43 and a breakout above this level was expected due to bullish market conditions. The Squeeze Momentum Indicator registered a green bar and the first light blue dot could offer a buy signal. The RSI headed towards the upper zone after rising steadily over the past few days.
A few targets were presented using the Fibonacci extension tool. The 100% extension lay around $49-50 and the $127.2% rested at $56. A pickup in the 24-hour trading volumes suggested that the price could trend in the breakout direction but further conviction was required.