Monero, MATIC and Binance Coin Price Analysis: July 28

Market capitalization of Monero increased, however, despite the rise in prices, MATIC and Binance Coin’s market capitalization witnessed a fall. XMR’s price showed chances of low volatility, while MATIC recorded a 47.2% weekly gain and lastly, Binance Coin could be headed towards a possible price breakout.
Monero

XMR/USD, TradingView
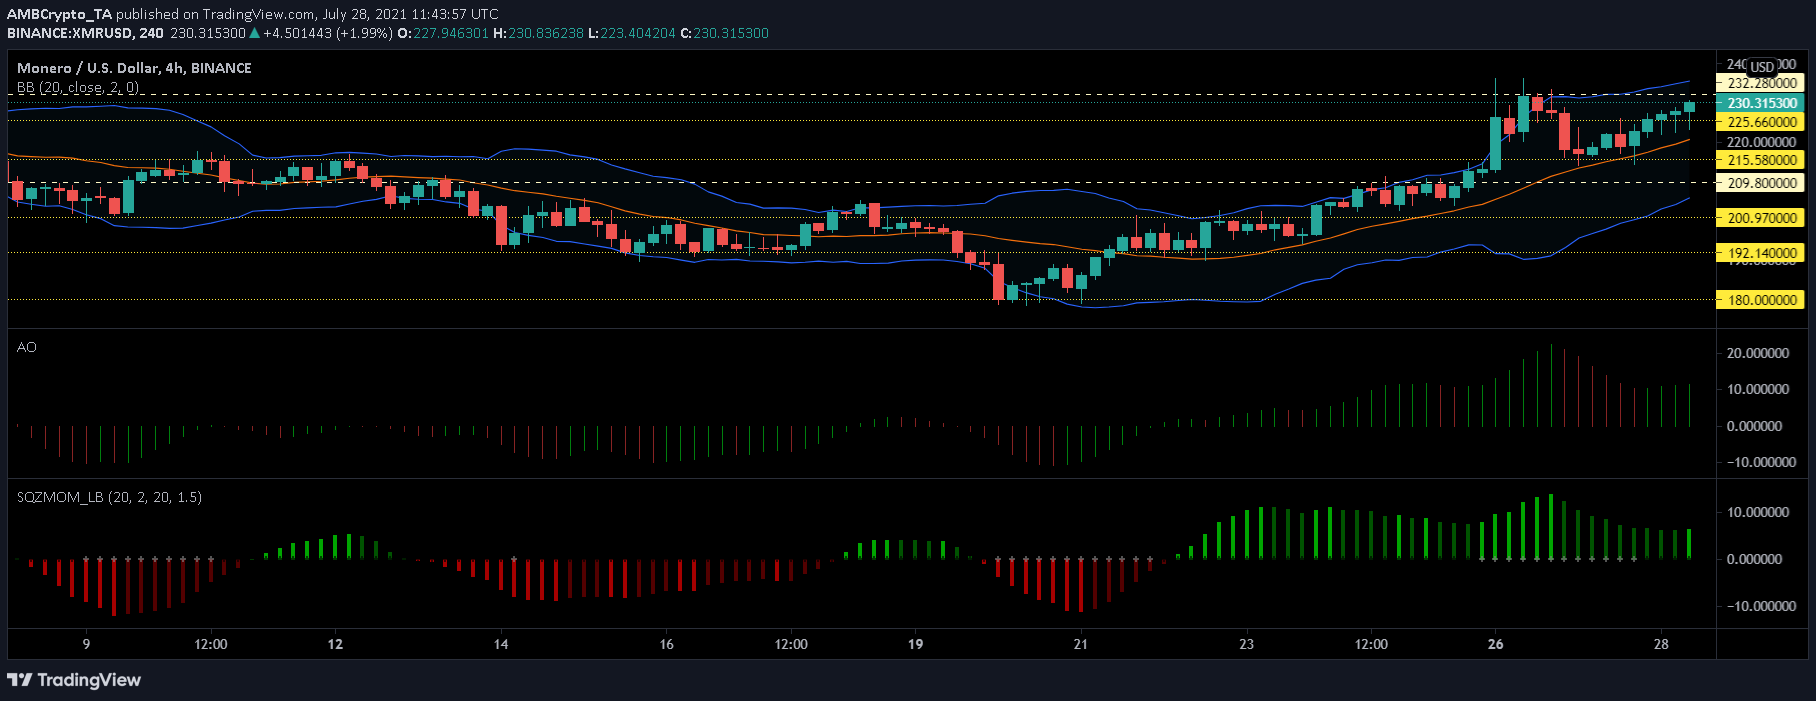
Monero’s price action was halted after yesterday’s plunge in prices, however, over the last 24 hours XMR rose by 2.5%. At press time, the coin was trading for $230, gaining 23.3% over the last week. On the upside, if bulls gain momentum, prices could see resistance at $232 and with a fall, support region lies at $215. Market capitalization increased by 3.62% overnight.
Bollinger Bands widened and stayed parallel, which signified that prices would trade with volatility, but remain within a restricted range over the upcoming trading sessions. The trading volume of the coin dipped 2.20% at press time. Squeeze Momentum Indicator entered a squeeze which signalled a period of comparatively less volatility.
MATIC

MATIC/USD, TradingView
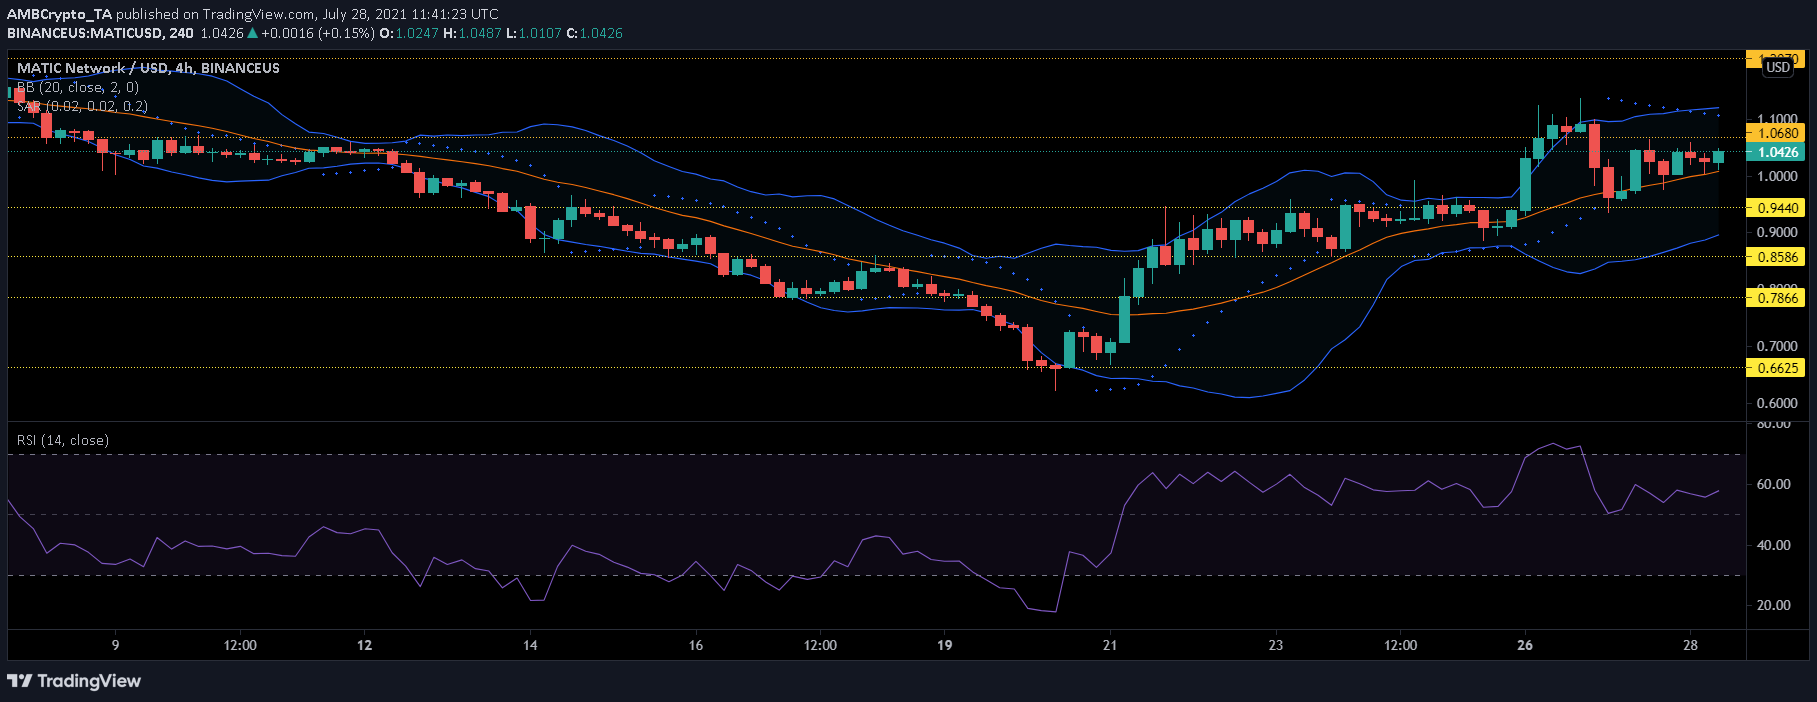
Over the weekly time frame, MATIC registered a staggering 47.2% rise in prices. On the downside, the support for the coin rested at $0.94 and with an increase in prices, MATIC might face resistance at the $1.06 level.
The downtrend of Parabolic SAR as seen on the 4-hour technical chart depicted its dotted lines above the candlesticks, which translated to a period of prices moving down. Bollinger Bands remained wide and parallel so price movement can be expected with the range.
Buying pressure also received an upward push as Relative Strength Index pictured inflow of money.
Binance Coin

BNB/USD, TradingView
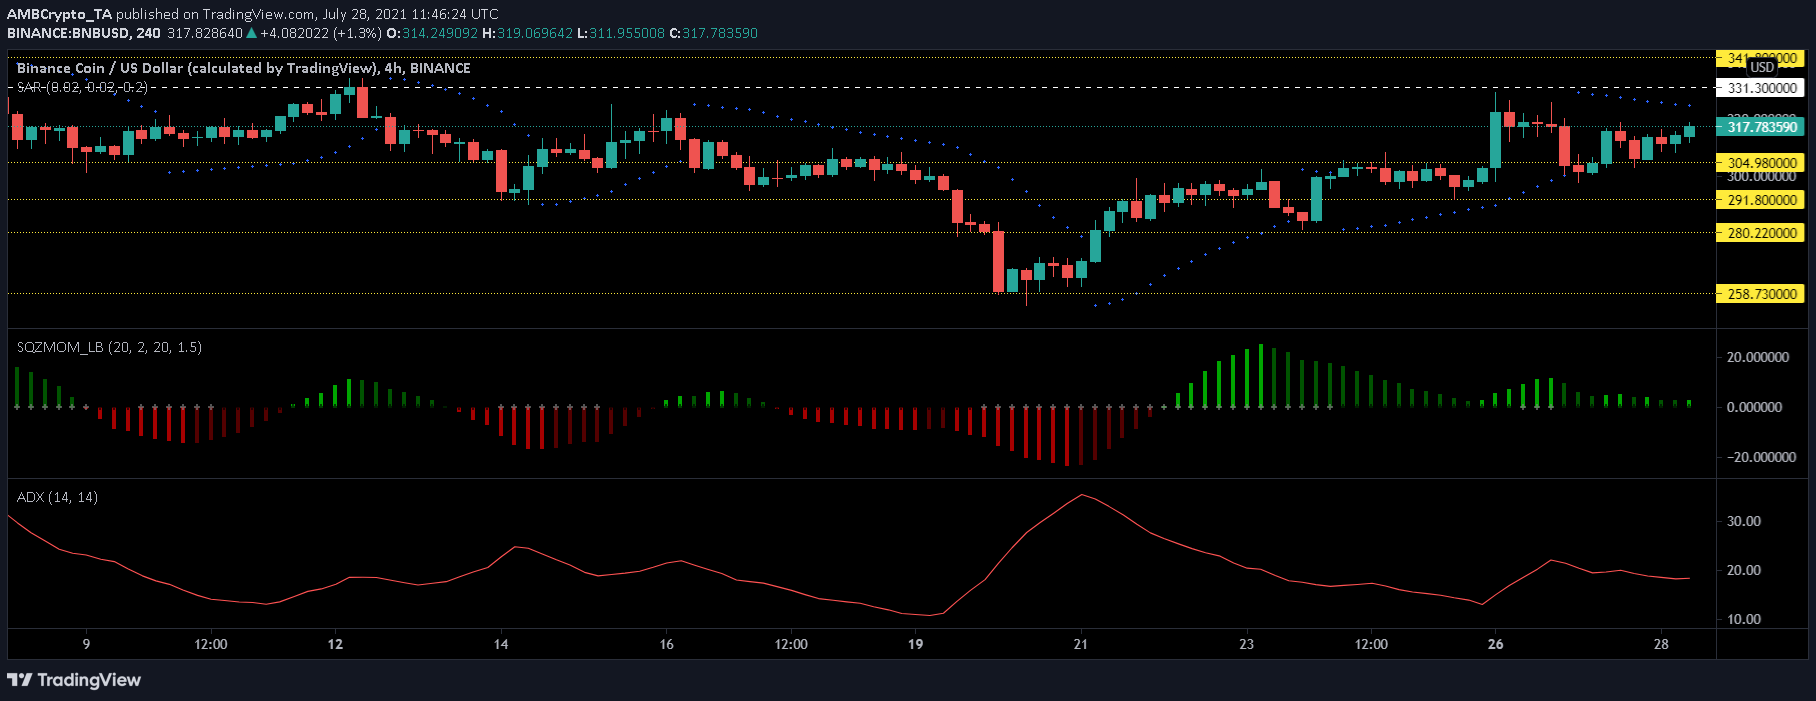
In the past seven days, the coin recovered quite a bit despite the regulatory issues. The coin was available for $317 at the time of writing.
The volatility aspect of BNB remained low as Squeeze Momentum Indicator pictured low volatility and a buy signal. Despite buying signals, BNB did not witness increased buying strength in the market as compared to other altcoins.
The market trend seemed to be weakening as Average Directional Index was seen at the 20-mark, which meant that a breakout could happen. Parabolic SAR’s dotted lines were hovering over the price level, indicating that a downtrend was in play.


