Monero, NEM, Augur Price Analysis: 23 March

Monero was trading at the helm of its $215.7-support level, with its bearish indicators spelling short-term losses over the coming sessions, at press time. On the contrary, NEM was moving within a horizontal channel, while Augur could extend its gains all the way up to the $50-mark.
Monero [XMR]
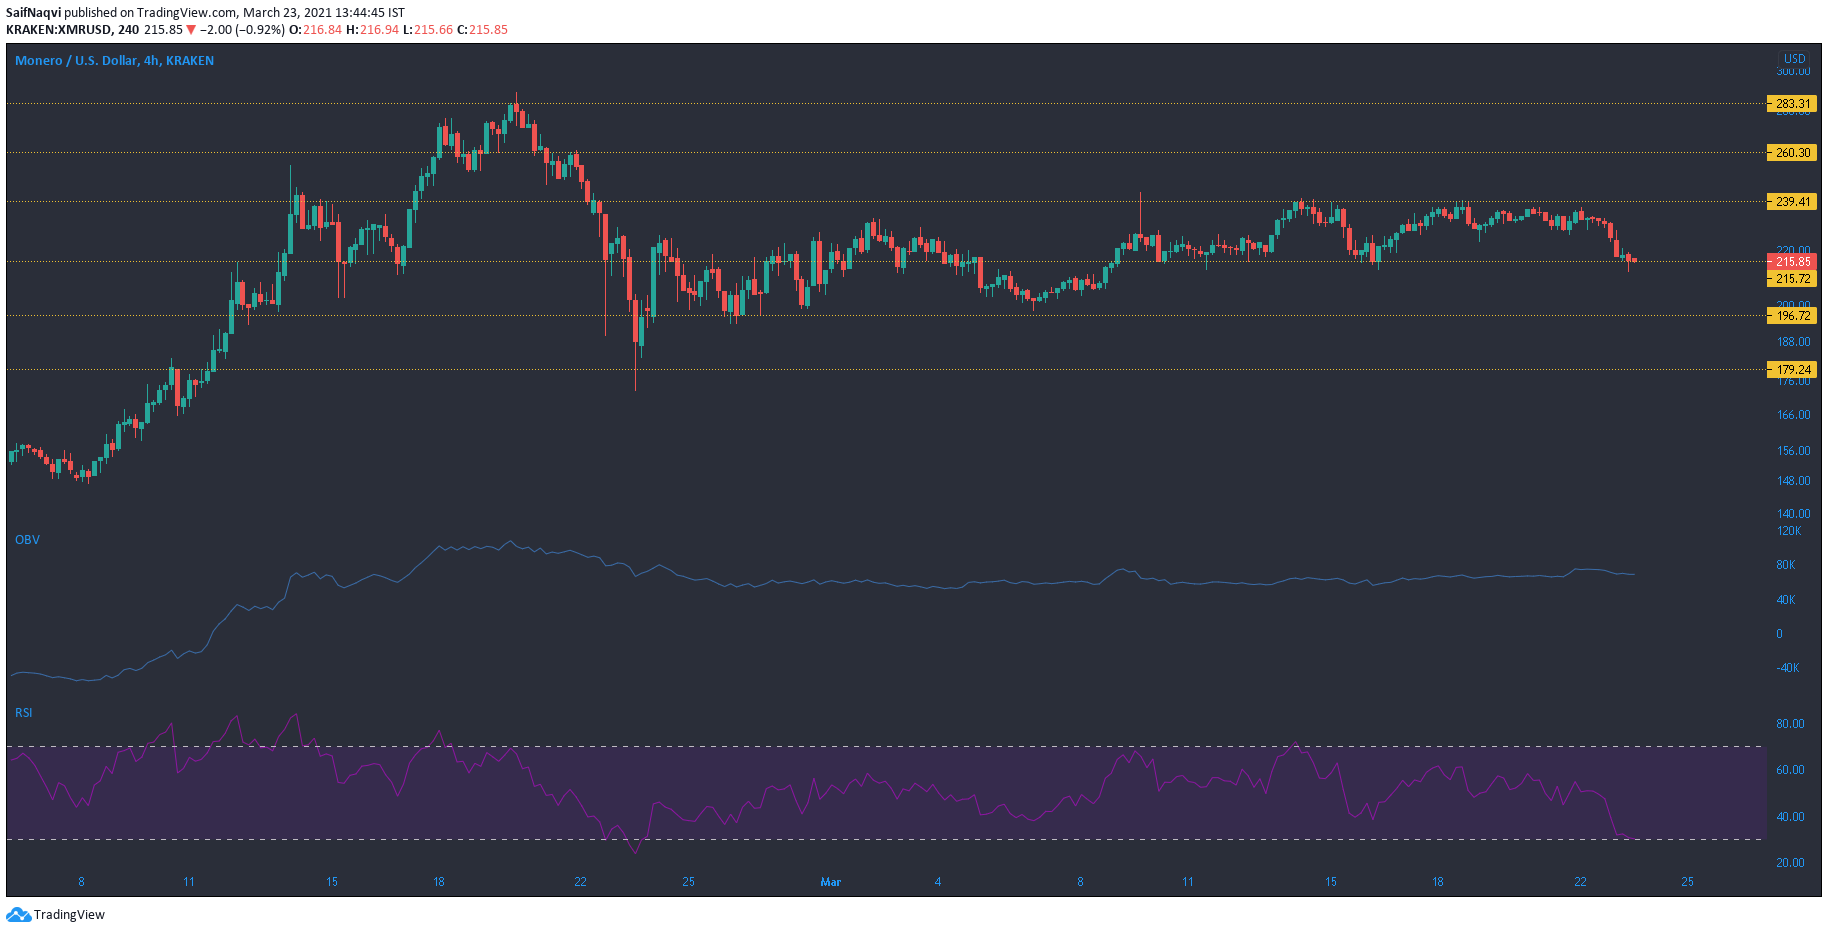
A look at Monero’s 4-hour chart highlighted a bearish trend as the crypto’s price tested the $215.7-support. The OBV took a dip and stabilized as the price approached the aforementioned mark. While the market bulls did seem to put up a fight, the RSI was on the verge of moving into the oversold territory, a development that could likely lead to a breakdown over the coming sessions.
A dip towards $196.7 is possible if the sell-off extends at the current price level as well. However, this could allow traders to take long positions as the next support level has served as a strong base for some buying activity in the past.
NEM [XEM]
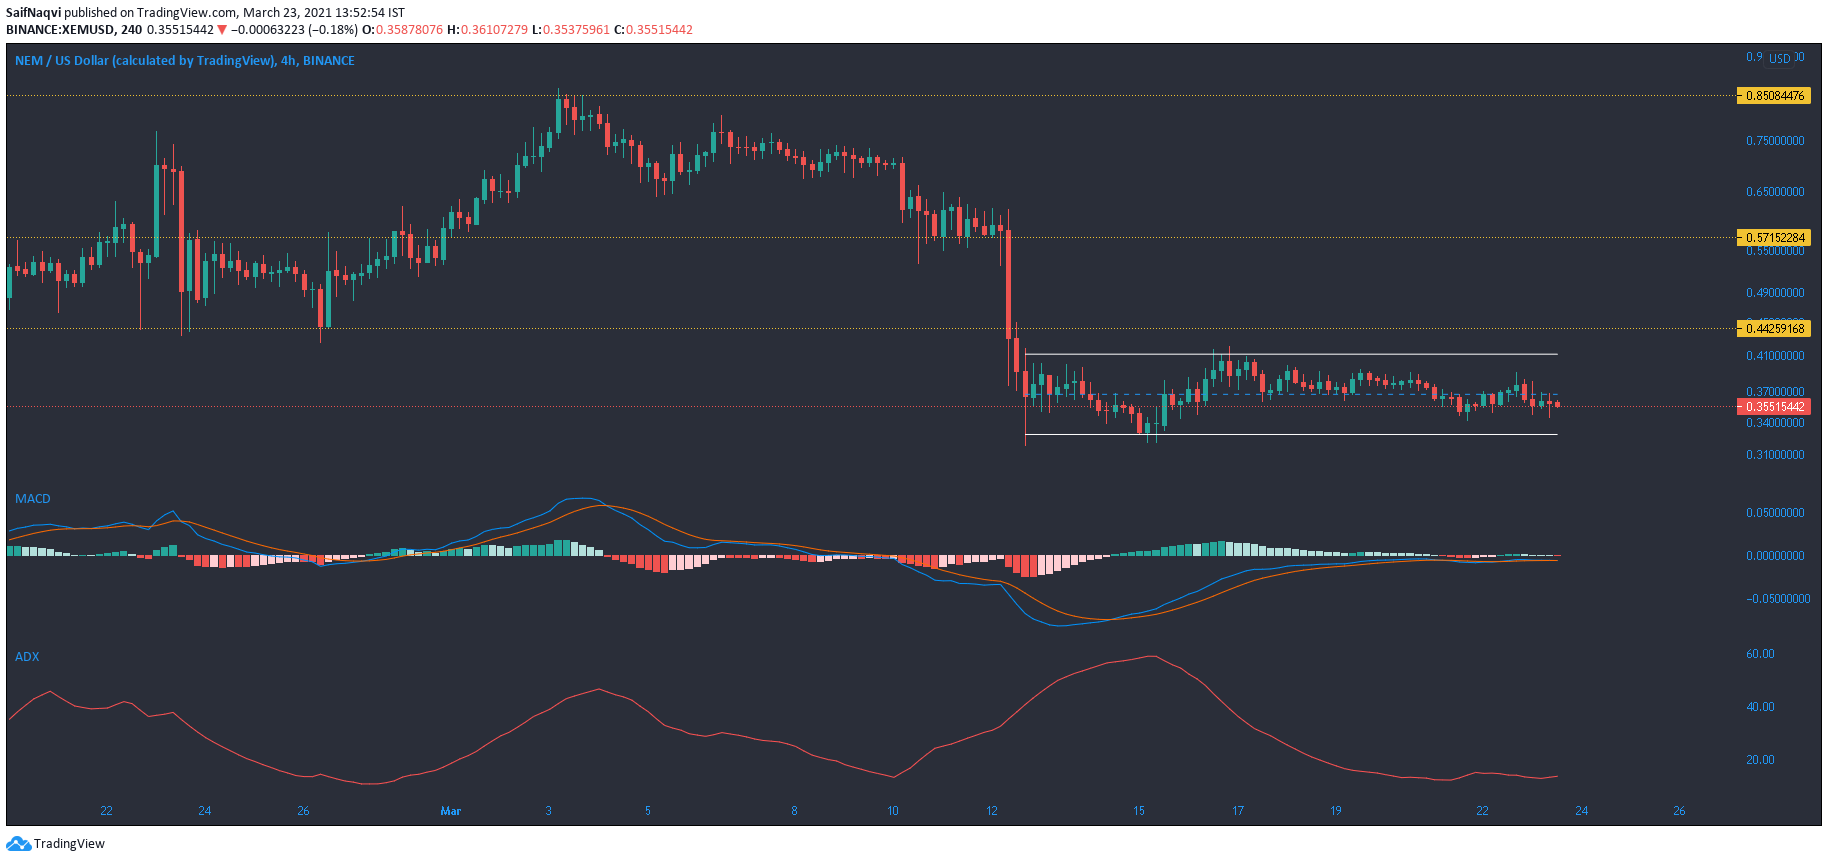
A sharp pullback on 12 March was brutal for NEM as the cryptocurrency struggled to see higher levels after that point. Since NEM was trading at a multi-year high of $0.85 prior to the pullback, it was possible that the price was in accumulation as traders prepared for the next big swing. The zone between $0.40 and $0.328 represented a horizontal channel as the market remained in equilibrium.
The MACD was bearish-neutral, while an ADX reading of under 15 highlighted a weak trend with respect to the price. For a bullish comeback, the first target for the market’s bulls lay at the $0.44-resistance level.
Augur [REP]
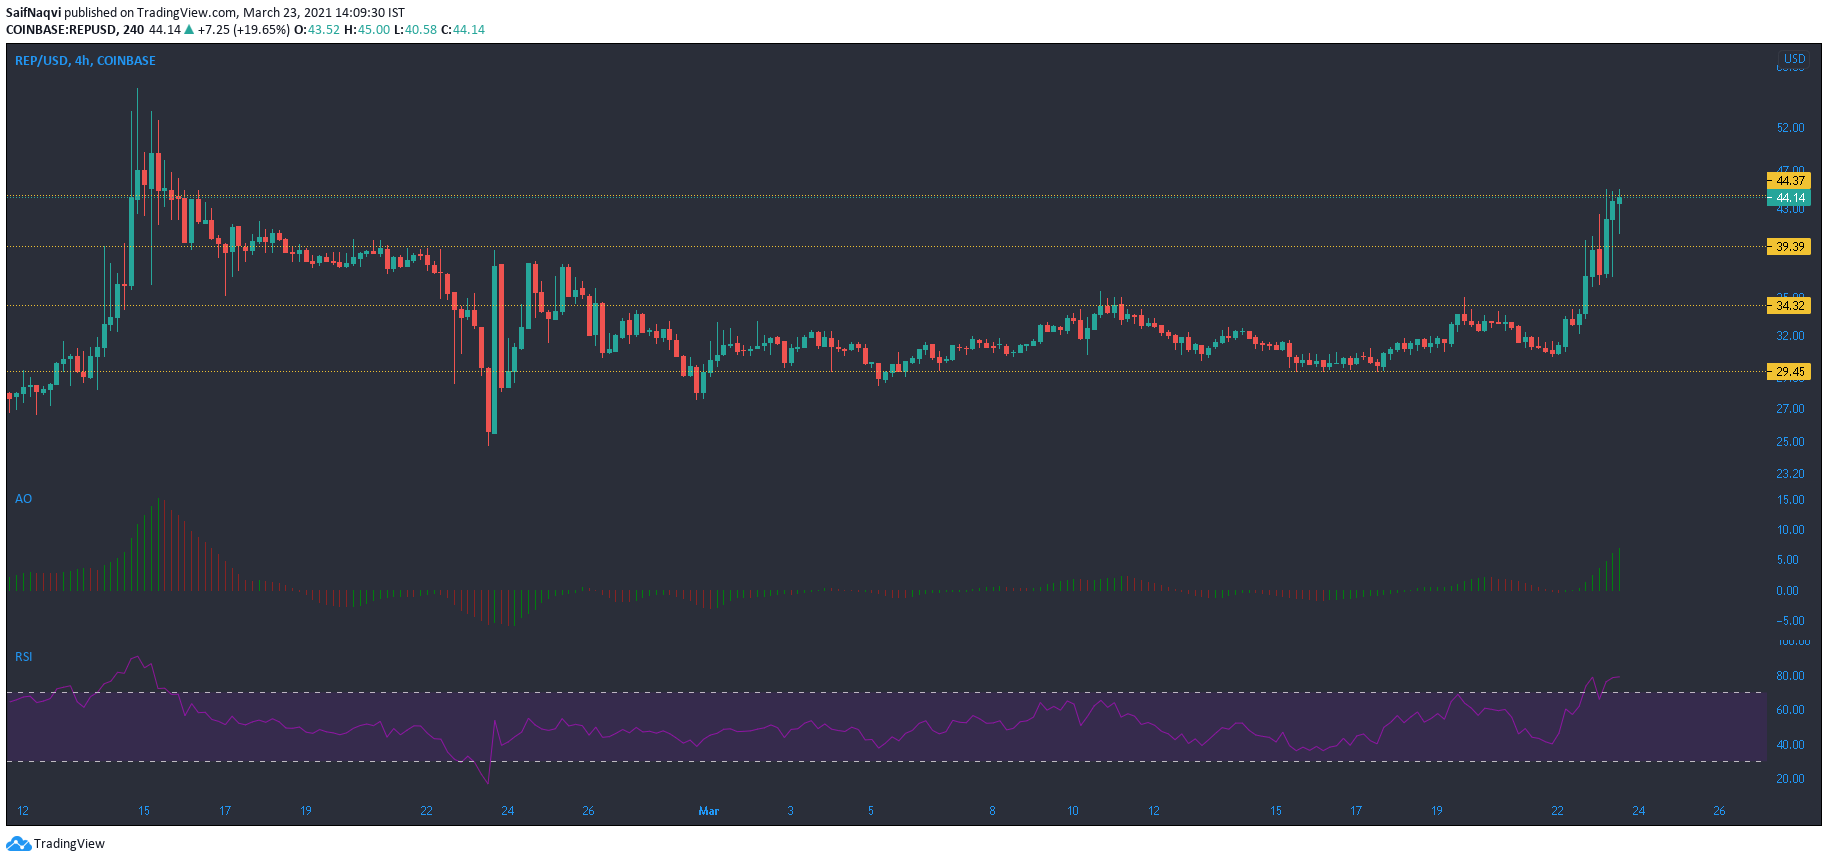
Bucking the broader market trend, Augur pictured bullish movement as the price rose north of the $40-mark. In fact, a bounce from the $30.7-support to the upper ceiling at $44.37 represented a gain of nearly 45% as the price broke upwards from a rangebound channel. The Awesome Oscillator saw strong momentum on the buying side after registering a series of rising green bars.
On the other hand, the RSI showed an oversaturation of buyers and reversed trajectory from the upper zone. This suggested that a correction was forthcoming.
The support mark at $39.9 could be under the spotlight if REP moves in the opposite direction. If the RSI does extend its movement in the upper zone, a hike towards the $50-level could be on the cards.