MOODENG crypto – Will the $0.64 resistance halt bulls once more?
The liquidation map showed that the $0.6145-$0.6312 zone had a large number of high-leverage short liquidation levels.
- Moo Deng had a bullish structure on the 12-hour chart and strong upward momentum.
- The high speculative interest but negative CMF reading raised doubts about the rally.
Moo Deng [MOODENG] crypto has rallied 91.5% in 20 hours, and the daily trading volume was up by nearly 800%. This strong price bounce came after the 61.8% Fibonacci retracement level was tested as support.
Yet, the $0.7 region posed credible opposition to the bulls’ advance. The buying volume in recent hours was strong, but over the past two weeks, it has been dominated by the sellers.
Is MOODENG crypto in a range formation?
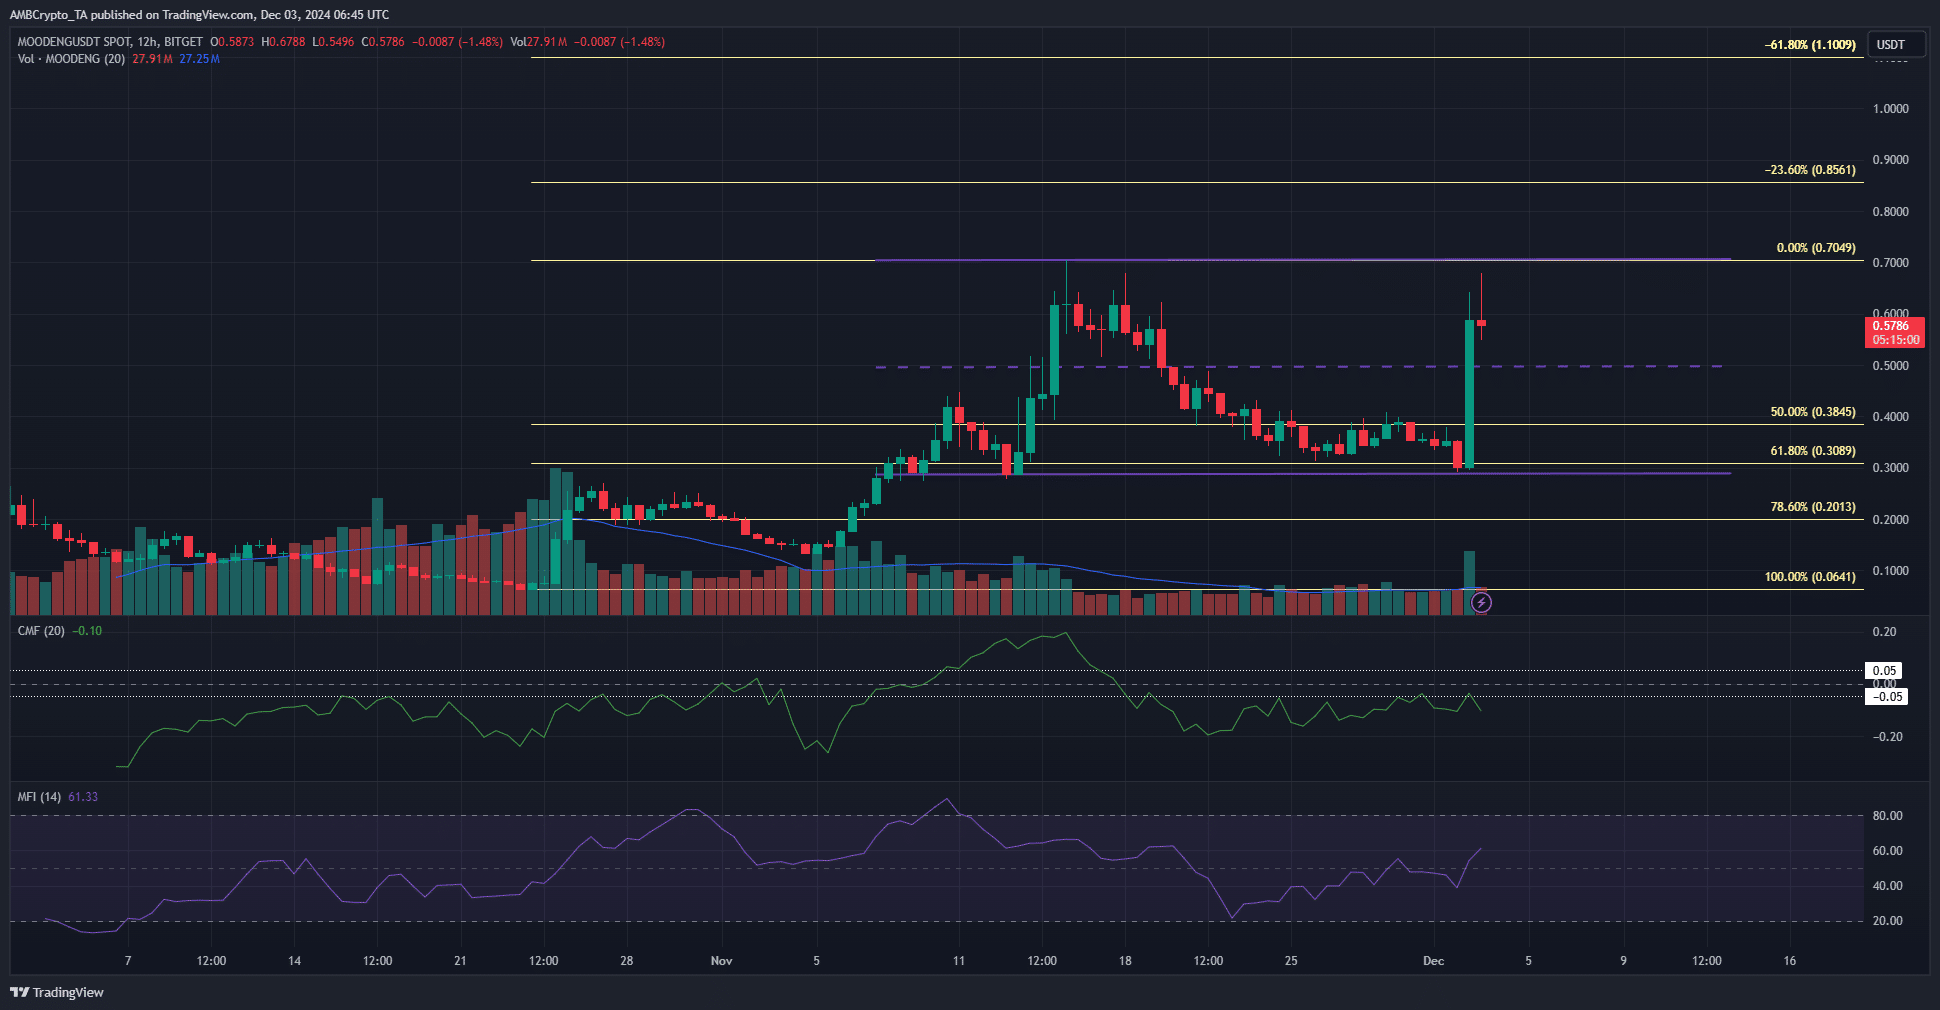
The RSI on the 12-hour chart jumped above neutral 50 on Monday the 2nd of December, showing bullish momentum.
The market structure also flipped bullishly when the meme coin rose above the recent lower high at $0.408.
At press time, the mid-range level at $0.5 is expected to act as support in the event of a price dip. In the past 16 hours of trading, the mid-November highs around $0.62-$0.7 have rebuffed bullish efforts to climb higher.
While the momentum and structure favored the buyers, the CMF was resolutely below -0.05 to indicate capital was flowing out of the market.
This meant that the recent days’ trading activity favored the sellers overall, although high volume toward the New York open on Monday helped MOODENG crypto prices soar.
Bullish sentiment grows
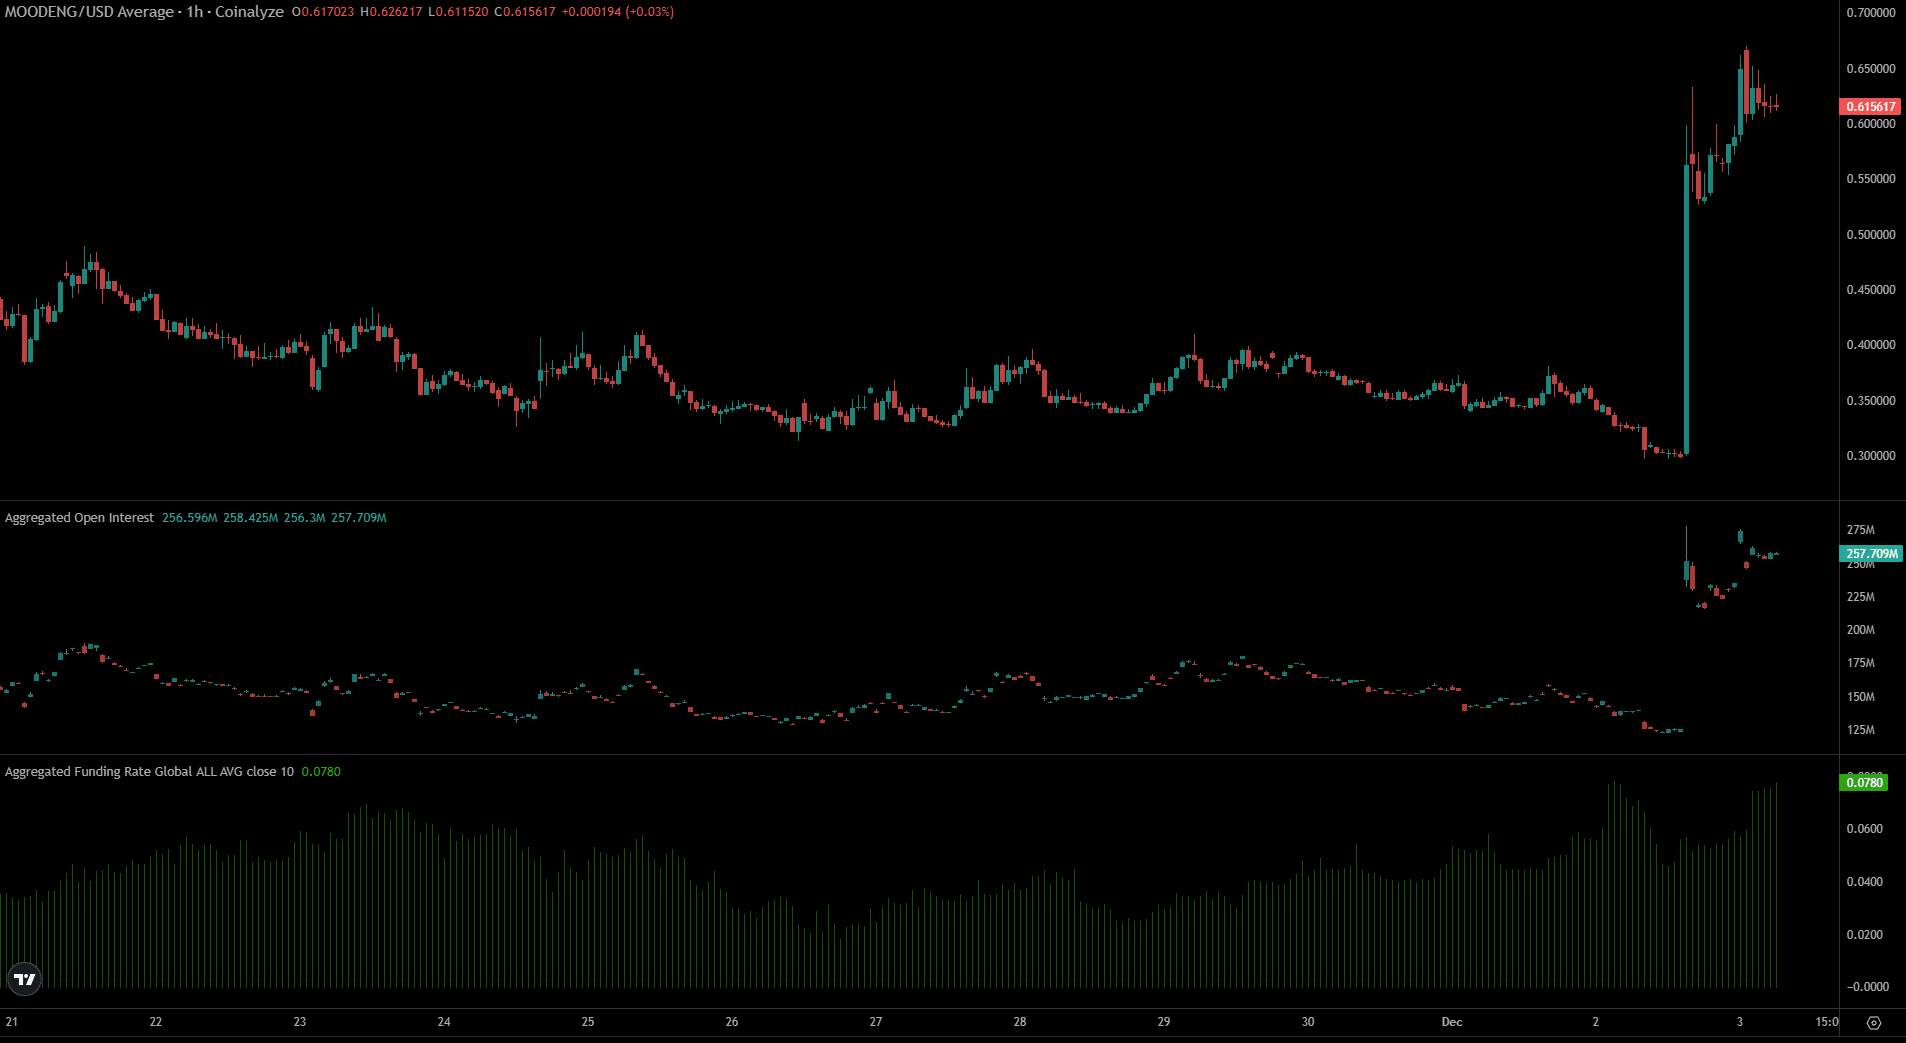
The Funding Rate has jumped higher over the past few days. The strong move the previous day meant the Open Interest rocketed from $125 million to $257 million at press time.
This suggested that the speculative market was keen on going long on the memecoin.
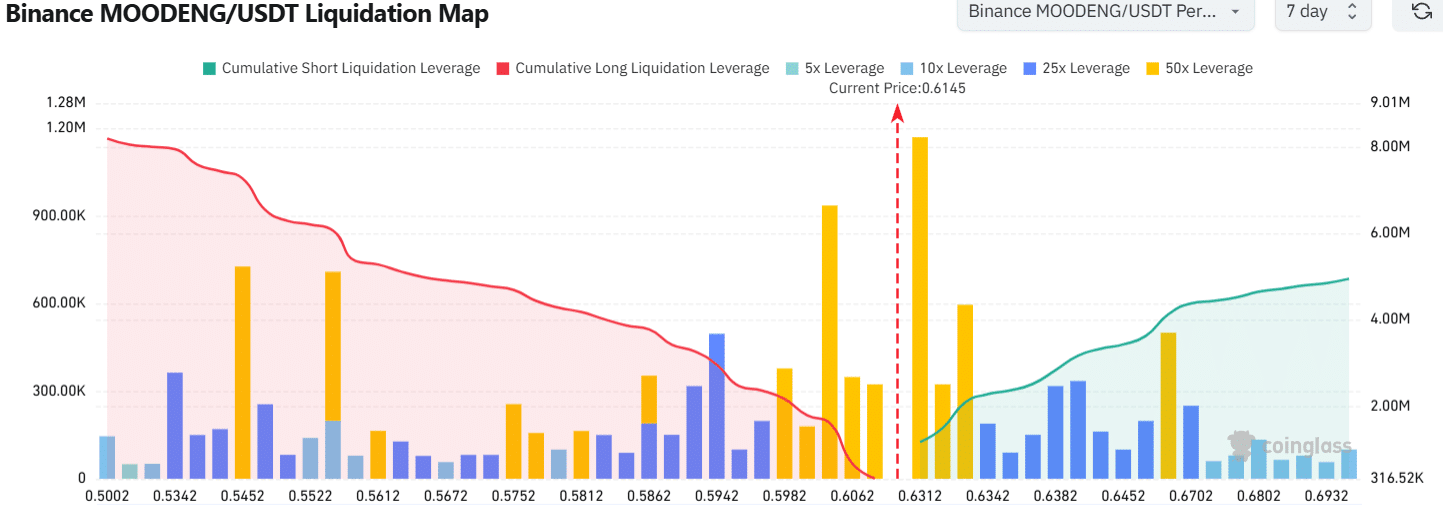
The liquidation map showed that the $0.6145-$0.6312 zone had a large number of high-leverage short liquidation levels. The price has witnessed rejection from $0.64 on Monday.
Is your portfolio green? Check the Moo Deng Profit Calculator
The price likely faces another reversal after a sweep of this short liquidation cluster. The CMF and the liquidation map indicated there might be a retracement for MOODENG crypto in the coming days.
Yet, caution is warranted, as the short-term sentiment was firmly bullish across the altcoin market. A move beyond $0.64 would be a sign that buyers were in control once again and that the rally could continue.
Disclaimer: The information presented does not constitute financial, investment, trading, or other types of advice and is solely the writer’s opinion