MOVE is up nearly 21% in 24 hours – Here’s what you should know before buying
Solitary volume and price spikes, followed by a bearish continuation of the higher timeframe trend, has been a theme for MOVE.

Movement [MOVE] has rallied by 20.77% over the past 24 hours. Its daily trading volume has surged tenfold, and there was a massive upward price wick. The 20% move was not the zenith of the move, as the altcoin had reached a local high of $0.03 a few hours earlier.
This was a whopping 108.6% higher than the current price, indicating extreme volatility in MOVE trends recently. It is unclear what caused the high volume, but it is clear that the huge influx of activity drove prices higher, then lower again.
It was also clear that the higher timeframe trend remained unchanged. Here’s what MOVE traders and holders need to watch out for.
Sustained volume is needed to shift MOVE trends
Consistency and sustained capital flows are needed to carry a long-term trend. Such flows can come for various reasons, but the main point is sustained flows.
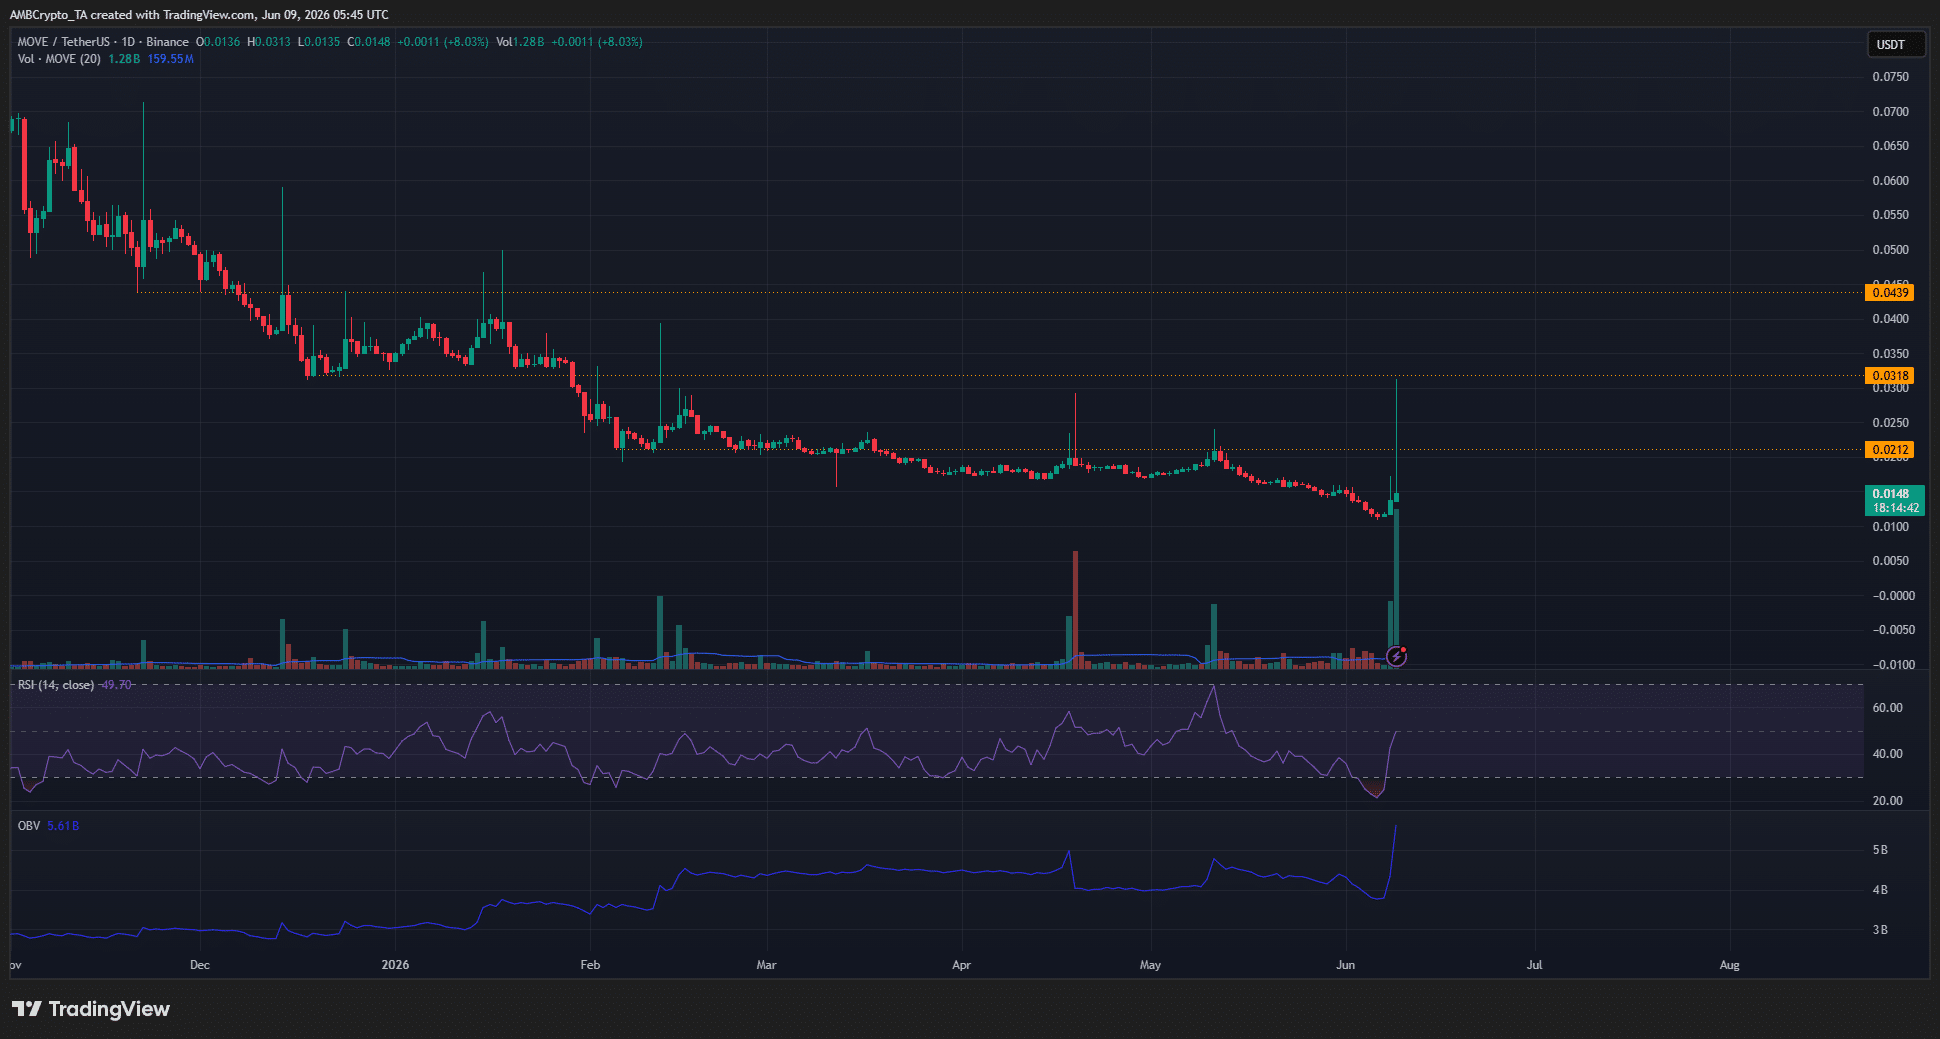
On Monday, the 8th of June, the daily trading volume was almost sixfold the 20-day volume’s moving average. Tuesday’s trading day has not yet concluded, but the volume was already 9x the 20-day moving average and more than double that of Monday’s volume.
Yet, these were isolated volume spikes so far. There have been a handful of such volume spikes in recent months that were unable to turn the higher timeframe downtrend around. For example, mid-April and early February.
Both incidents saw large upward price spikes, but these were followed by a steady downward price move in the following weeks.
Traders’ call to action – Trust the trend
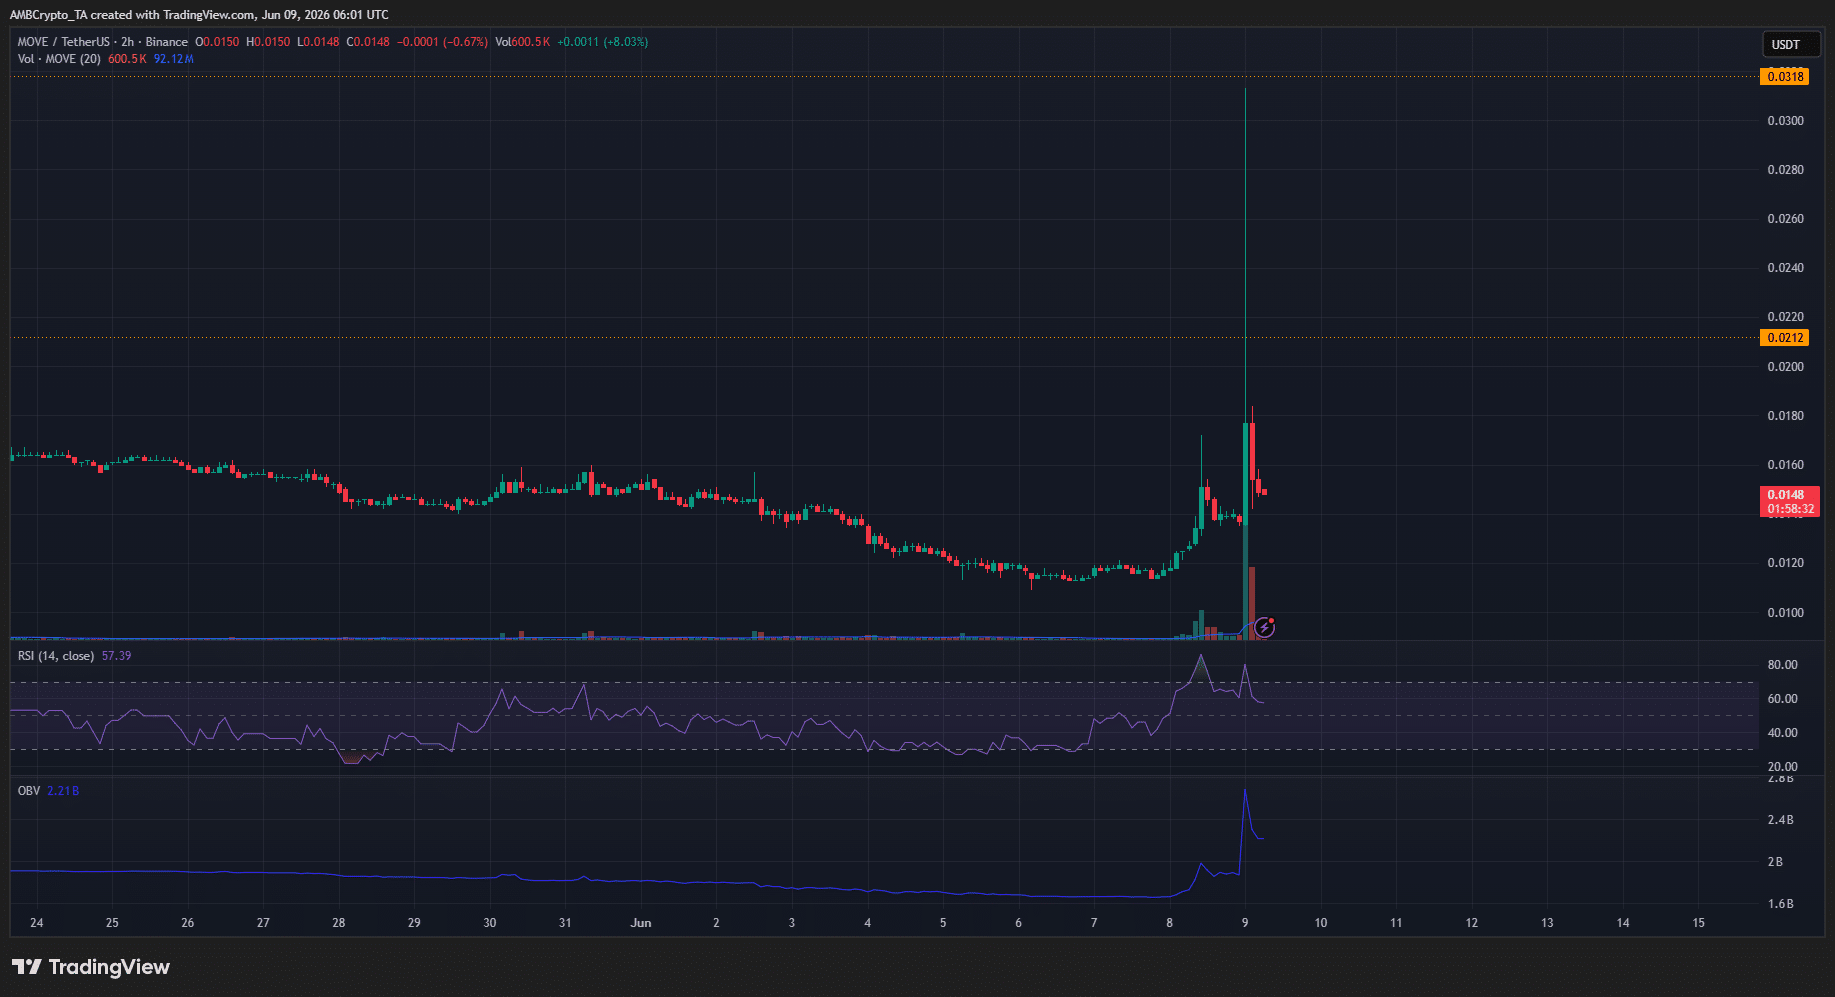
The hourly RSI already flashed a bearish divergence against the price, forming a lower low even as the price raced higher. The OBV also saw a large upward spike, but this might not mean much if key resistance levels are left untouched.
At press time, the $0.0212 is one such level to watch out for. Technically, the $0.02-$0.029 area is a supply zone due to the large upward wick made on Sunday, the 19th of April.
MOVE might be trending on social media due to volatility and high volume, but traders should remain cautious about trying to go long here.
Final Summary
- Movement prices doubled in the trading hours before press time on Tuesday, but the rally has swiftly retraced.
- Solitary volume and price spikes, followed by a bearish continuation of the higher timeframe trend, have been a theme for MOVE in recent months.