- NEAR’s bullish market structure seemed contrary to the disappointing market demand
- Spot CVD presented some hope that the bulls could defend $3.85
NEAR Protocol [NEAR], at press time, was on a downtrend across the higher timeframes. On the charts, the bulls found refuge at the $3.85-level, which was the 78.6% Fibonacci retracement level based on the rally from $2.45 to $9 in February and March.
Since then, the market structure has been flipped bullishly a couple of times. Now, even though the structure was bullish at press time, the outlook for the token was bearish.
Rejection from $5 and sustained bearish pressure
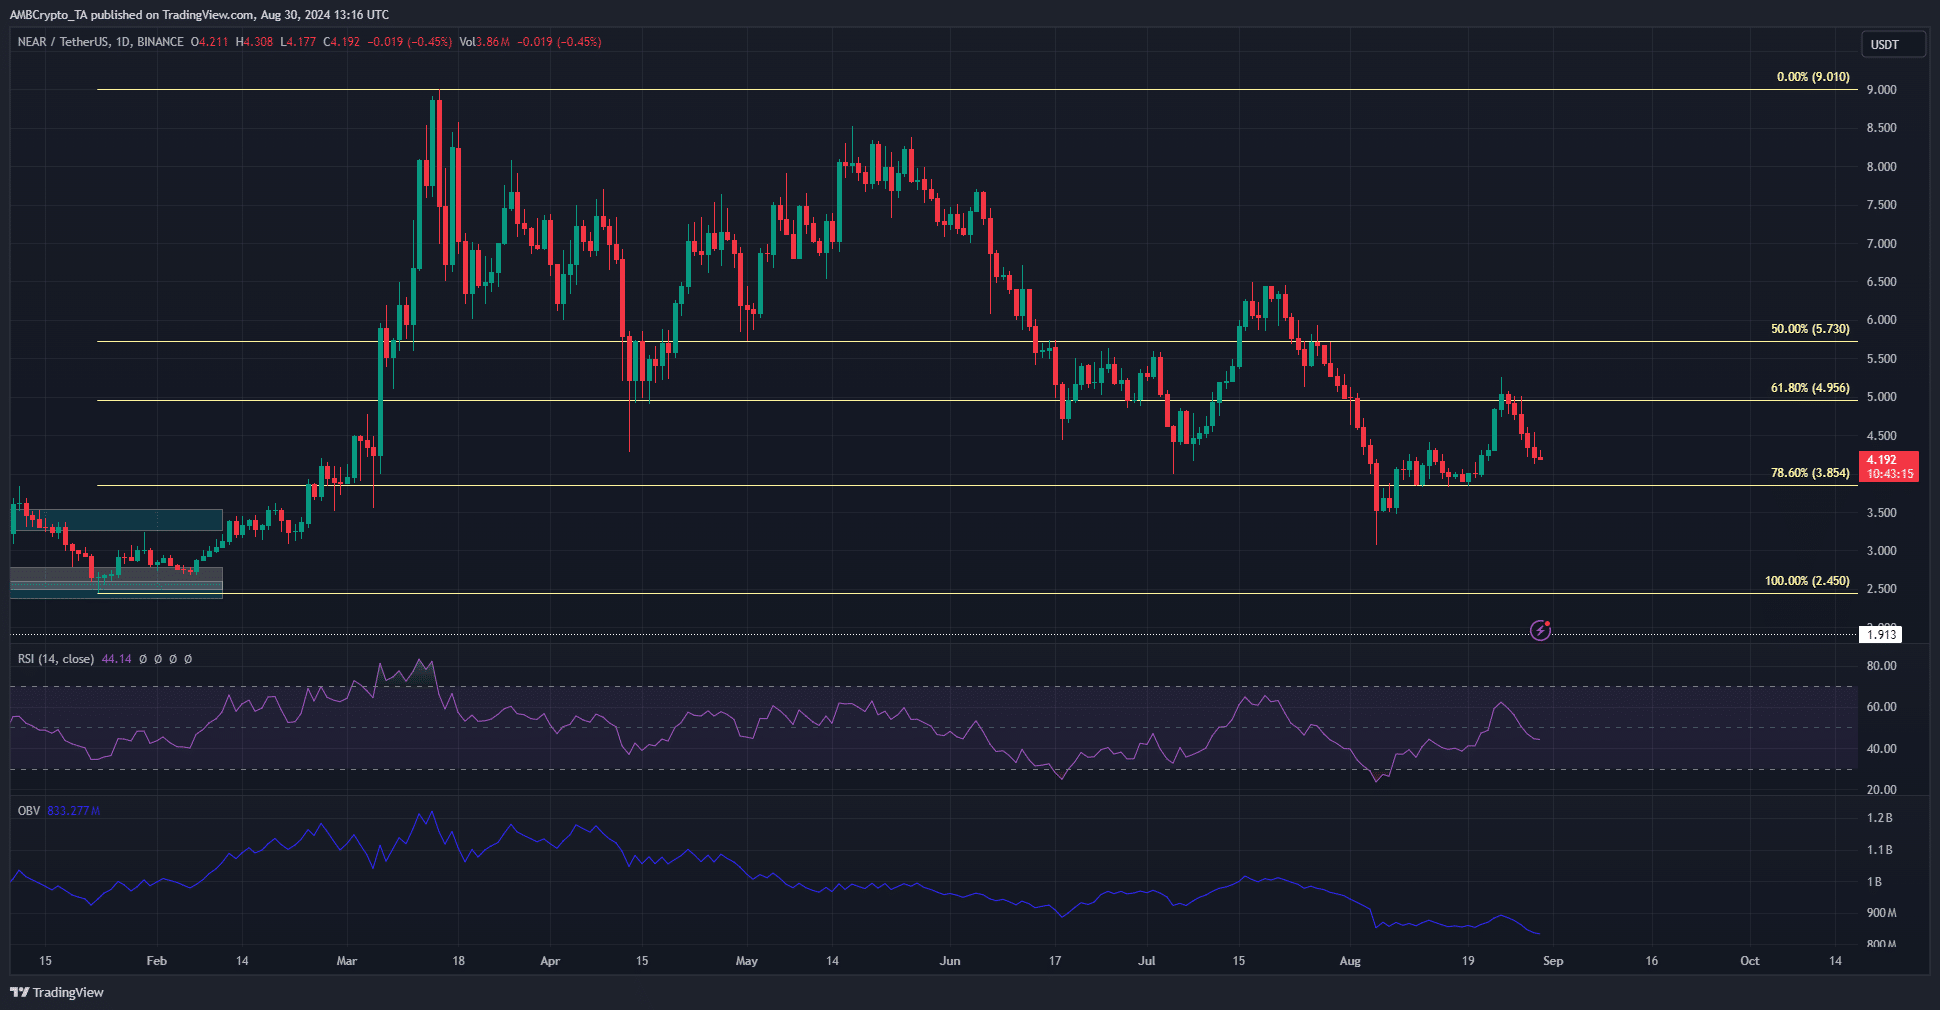
Source: NEAR/USDT on TradingView
This bearish outlook boils down to the OBV’s consistent downtrend. The steady stream of selling meant that even though NEAR has been trading above a higher timeframe, it must hold support level at $3.85.
The price bounced from $3.85 the previous week, and the token rose to $5.25. Alas, it was unable to flip the level to support in the subsequent days.
The daily RSI also dropped below neutral 50 after the recent price drop to show a shift in momentum. Investors would be hoping for a range formation around the $4-zone and a slow rise in the OBV to indicate accumulation.
Unless these work out as stated, the higher timeframe outlook would appear bleak for NEAR’s price.
Spot CVD keeping up, despite NEAR’s price drop
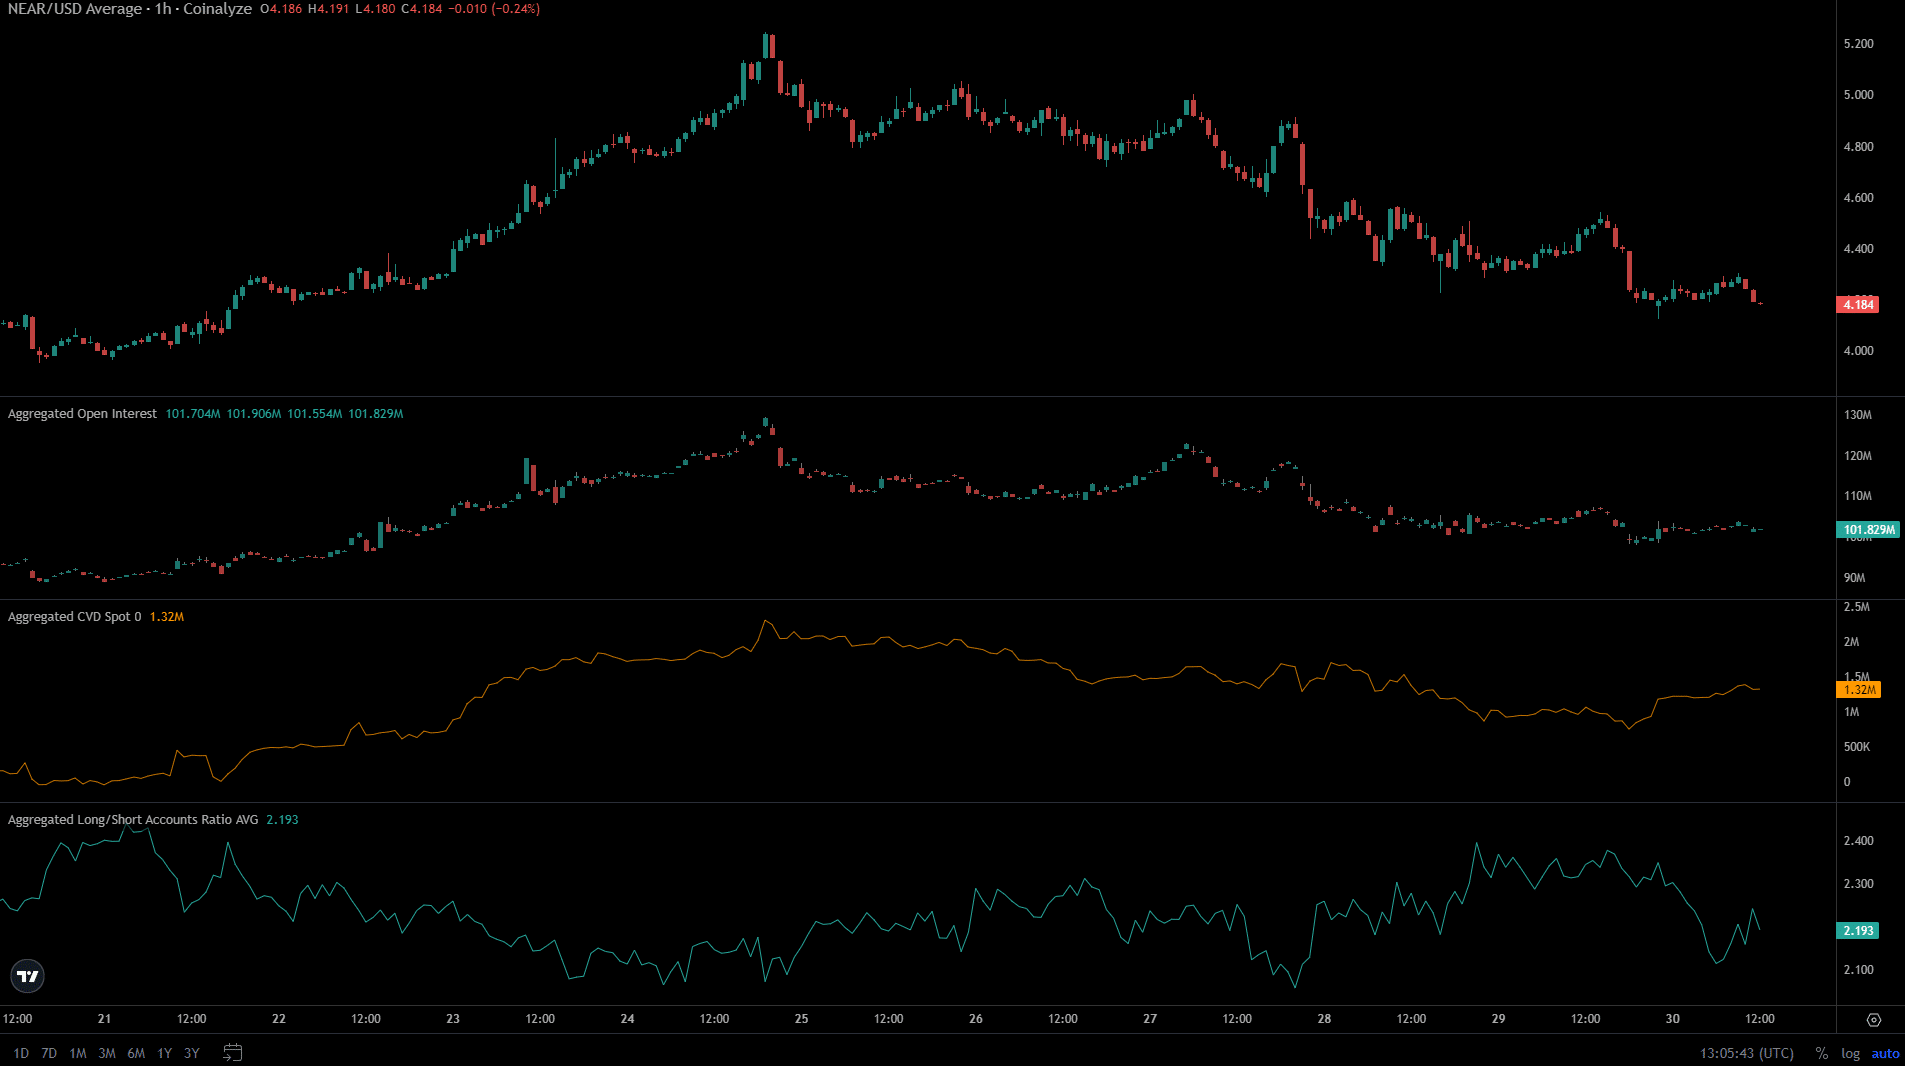
Source: Coinalyze
Over the past few days, the Open Interest behind NEAR Protocol has been falling alongside the price. This indicated a bearish sentiment in the Futures market.
The long/short accounts ratio also saw a decline over the past 24 hours, but remained at a healthy 2.19 to suggest that there were more longs than shorts.
Realistic or not, here’s NEAR’s market cap in BTC’s terms
Surprisingly, even though the price was struggling across a short-term downtrend, the spot CVD was rising. This hike in buying pressure might give traders some hope that NEAR could bounce from the $4 support zone once again.