- BTC’s price volatility dropped last week as it was in a consolidation phase
- Meanwhile, BTC’s exchange reserve fell too, indicating its rising demand
Bitcoin [BTC] hasn’t showcased much volatility over the last few days as its price seemed to be hovering around $60k. In the meantime, BTC’s demand increased sharply, which could soon have an impact on its price.
Hence, it’s worth taking a closer look at what’s going on.
Why is Bitcoin consolidating?
CoinMarketCap’s data revealed that BTC’s price dropped by 2% over the past week – Not a major decline. On the contrary, in the last 24 hours, the crypto’s value rose by 1%. At press time, BTC was trading at $59,172.68 with a market capitalization of over $1.17 trillion.
The fact that the cryptocurrency’s volatility dropped last week was further proven by the massive dip in its 1-week price volatility chart over the last few days.
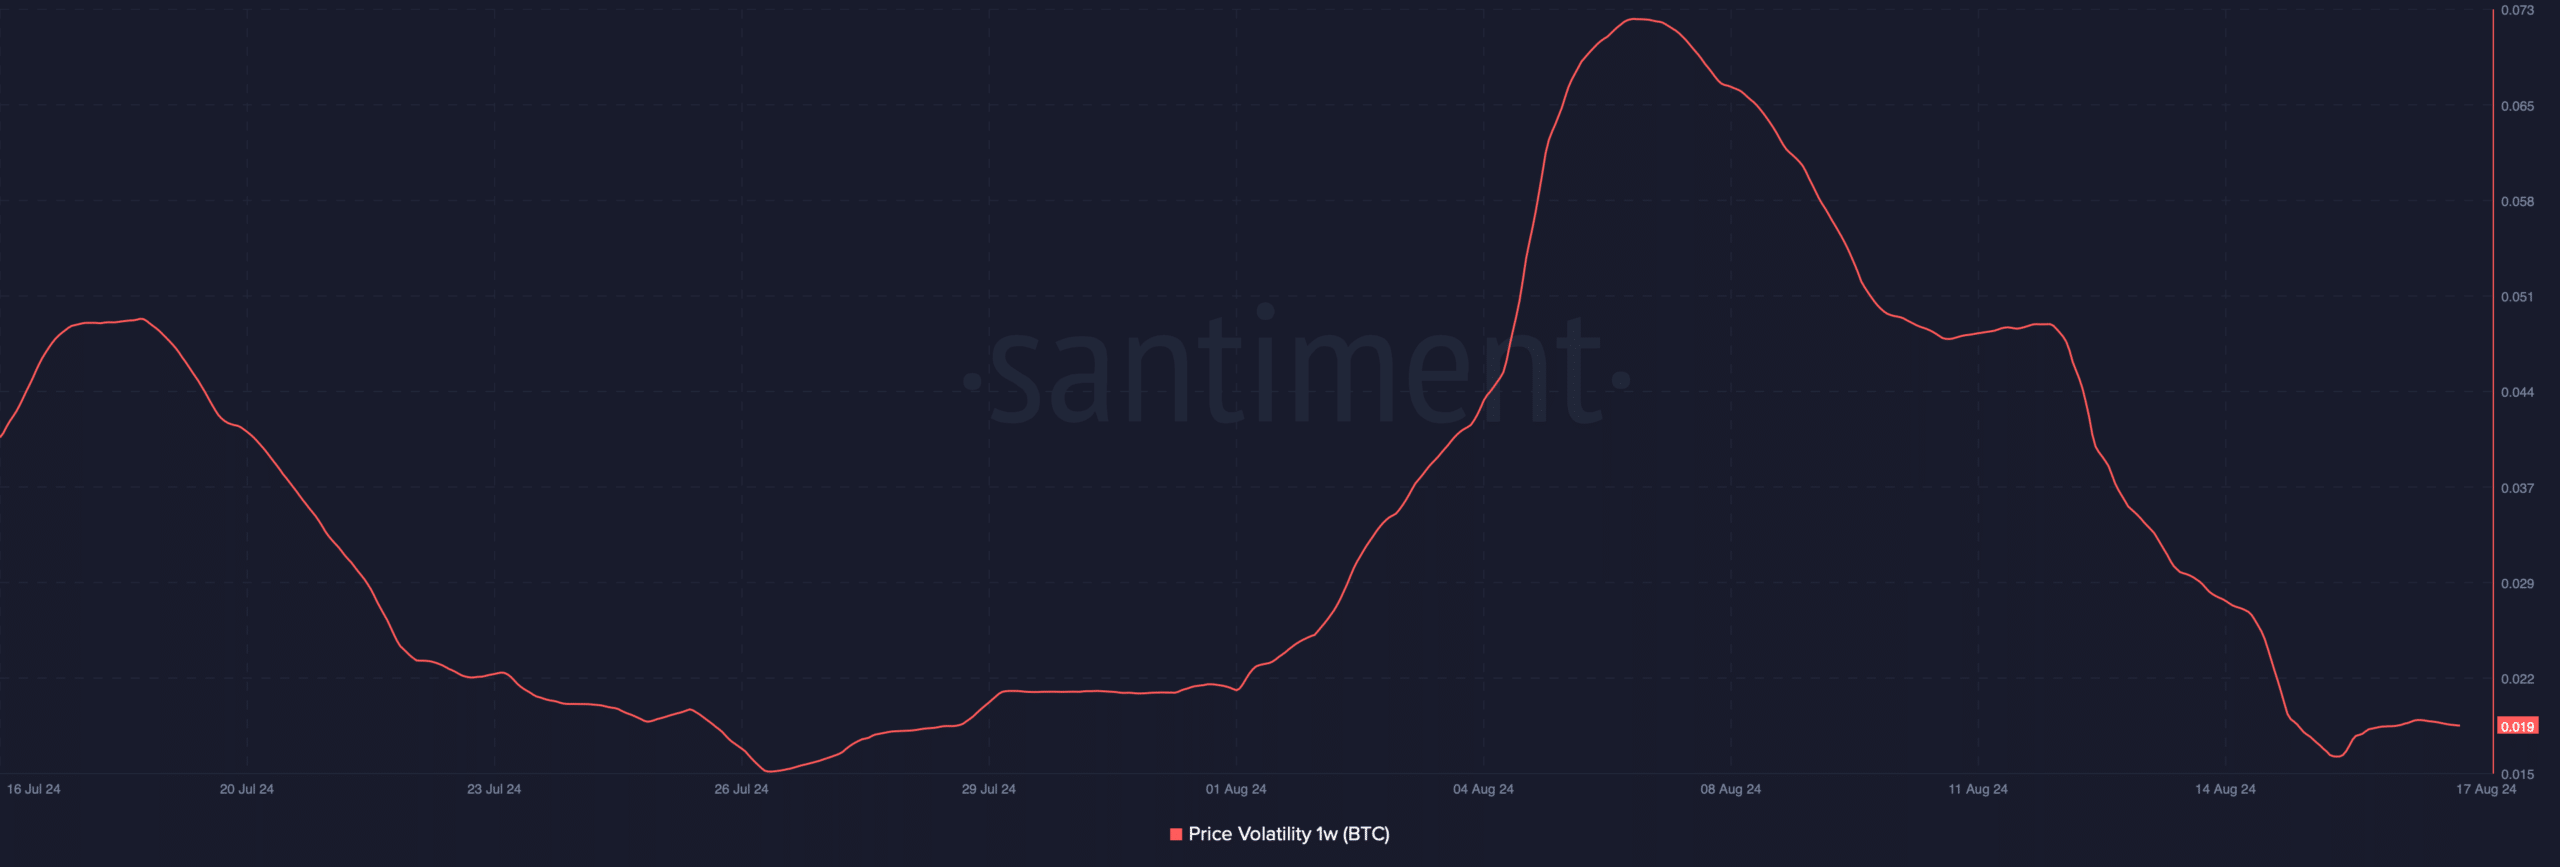
Source: Santiment
Quinten, a popular crypto analyst, recently shared a tweet that posited a possible reason behind the decline in volatility.
According to the same, BTC may be following a historical trend, one which it has showcased after each halving. He argued that since BTC has been in a consolidation phase for a few weeks now, if history repeats itself, we might see BTC’s price skyrocket in Q4 2024.
The bull rally might as well allow the king of cryptos to touch an all-time high on the charts.
BTC’s demand is on the rise
As Bitcoin consolidated, demand for the cryptocurrency rose too.
AMBCrypto’s analysis of CryptoQuant’s data revealed that BTC’s exchange reserves dropped significantly in 2024. What this implies is that BTC has been under a supply squeeze. Whenever demand increases and supply drops, it points to a price hike in the coming weeks or months.
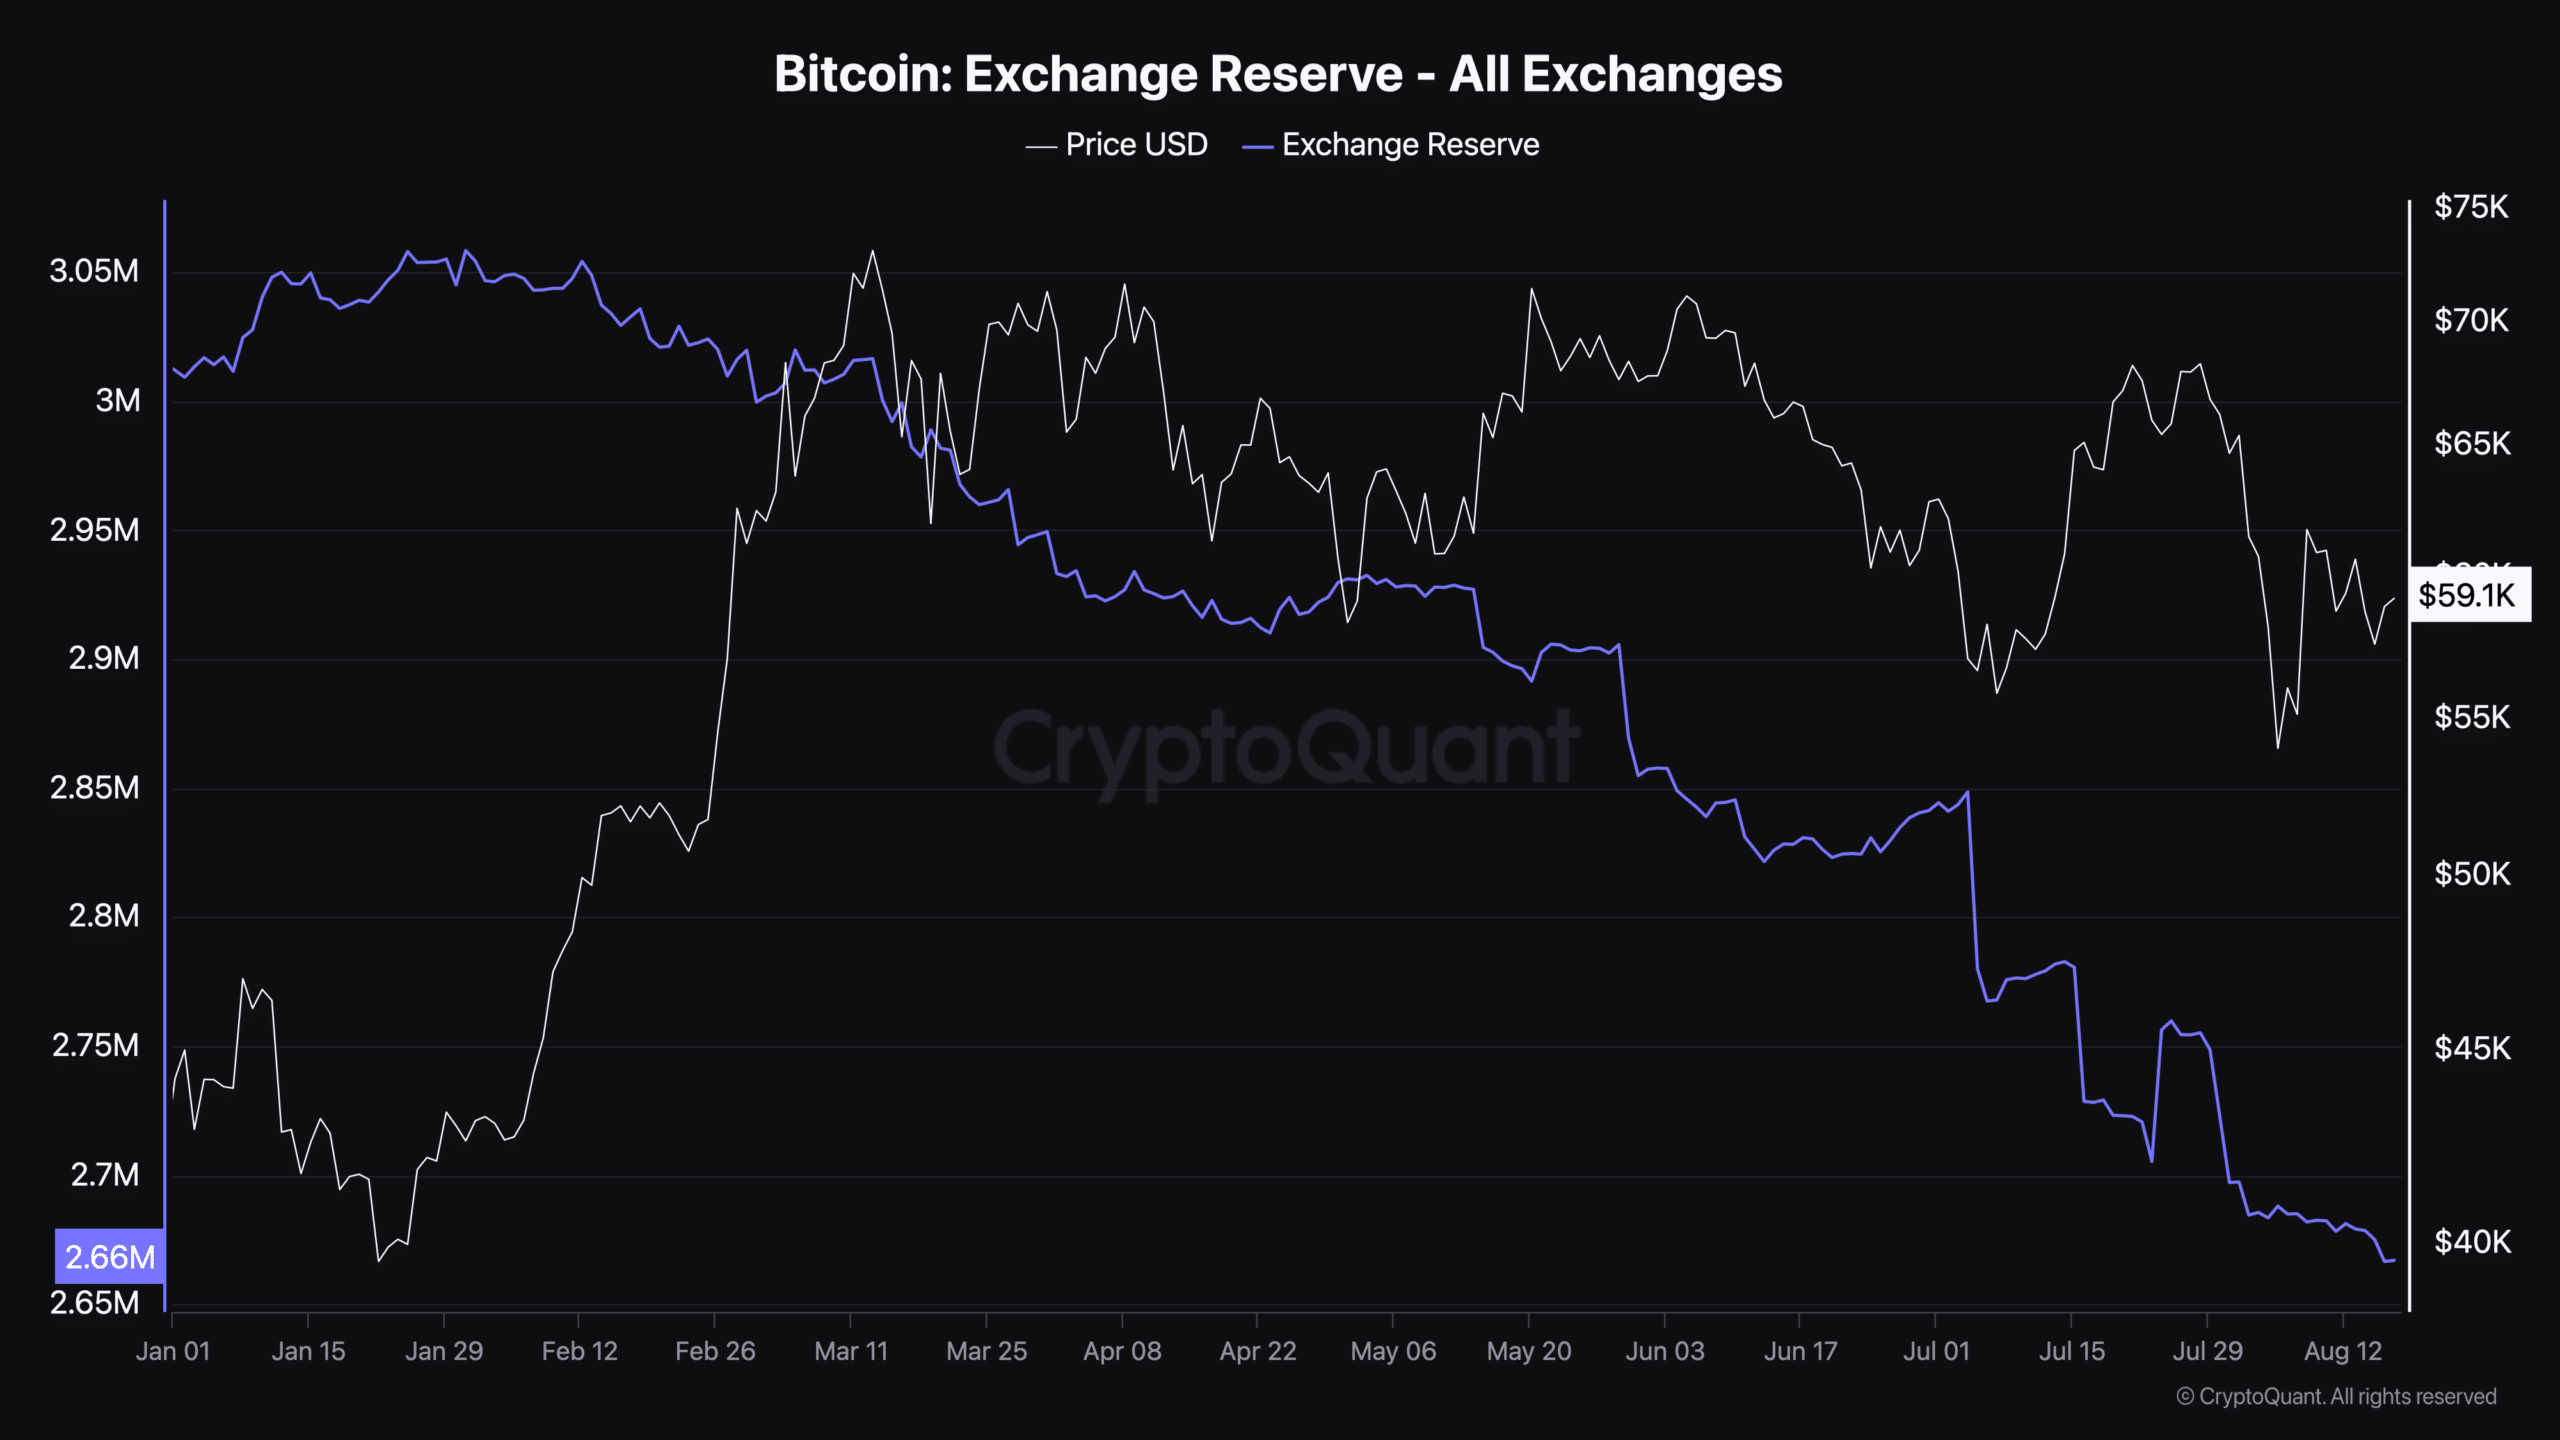
Source: CryptoQuant
We then took a look at Glassnode’s data to verify the rising demand for BTC. According to our analysis, the crypto’s accumulation trend score had a reading of 0.94 at press time.
For starters, this metric is an indicator that reflects the relative size of entities that are actively accumulating coins on-chain in terms of their BTC holdings. A value closer to 1 is a sign of high buying pressure, while a value closer to 0 suggests that investors are not accumulating.
Therefore, this metric established the fact that Bitcoin’s demand has been rising, which could result in a bull rally in Q4.
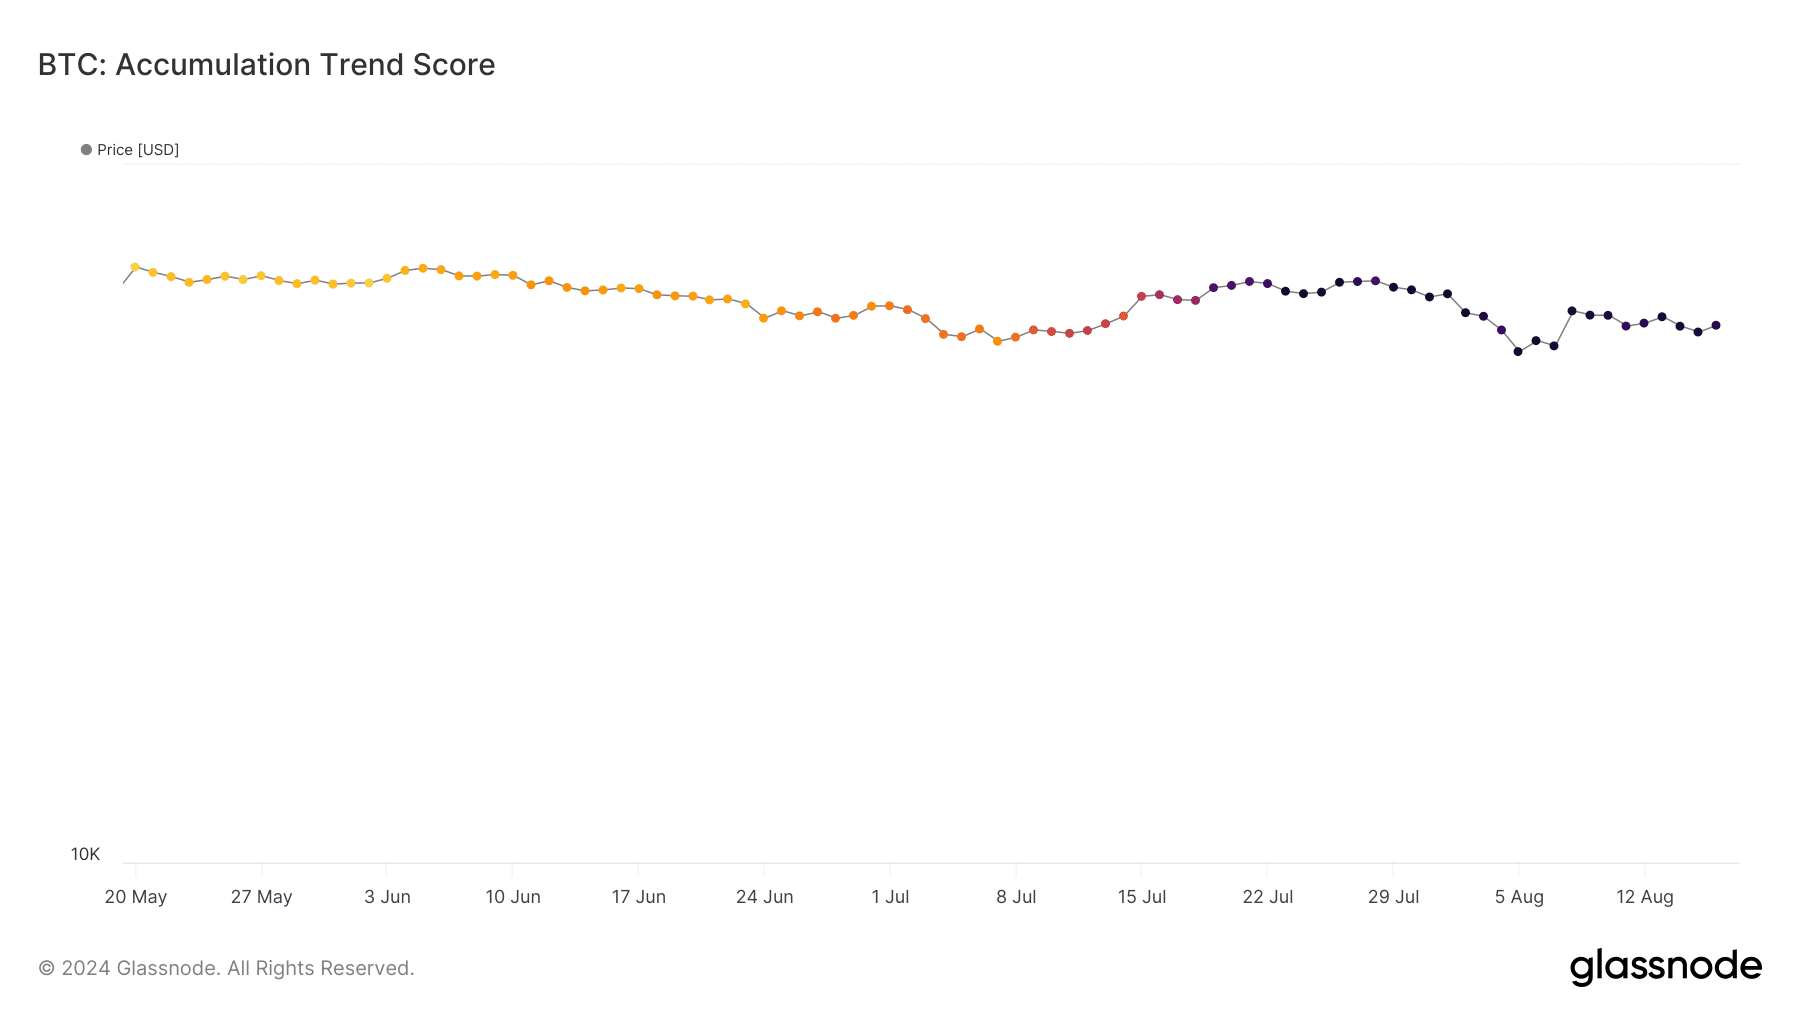
Source: Glassnode
Finally, we assessed the cryptocurrency’s daily chart to find out what to expect in the near term.
The Bollinger Bands revealed that BTC was about to test its resistance near the 20-day Simple Moving Average (SMA).
Is your portfolio green? Check out the BTC Profit Calculator
Its Relative Strength Index (RSI) registered an uptick too, suggesting that BTC might break above its 20-day SMA. On the contrary, the Chaikin Money Flow (CMF) looked bearish as it moved south on the charts.
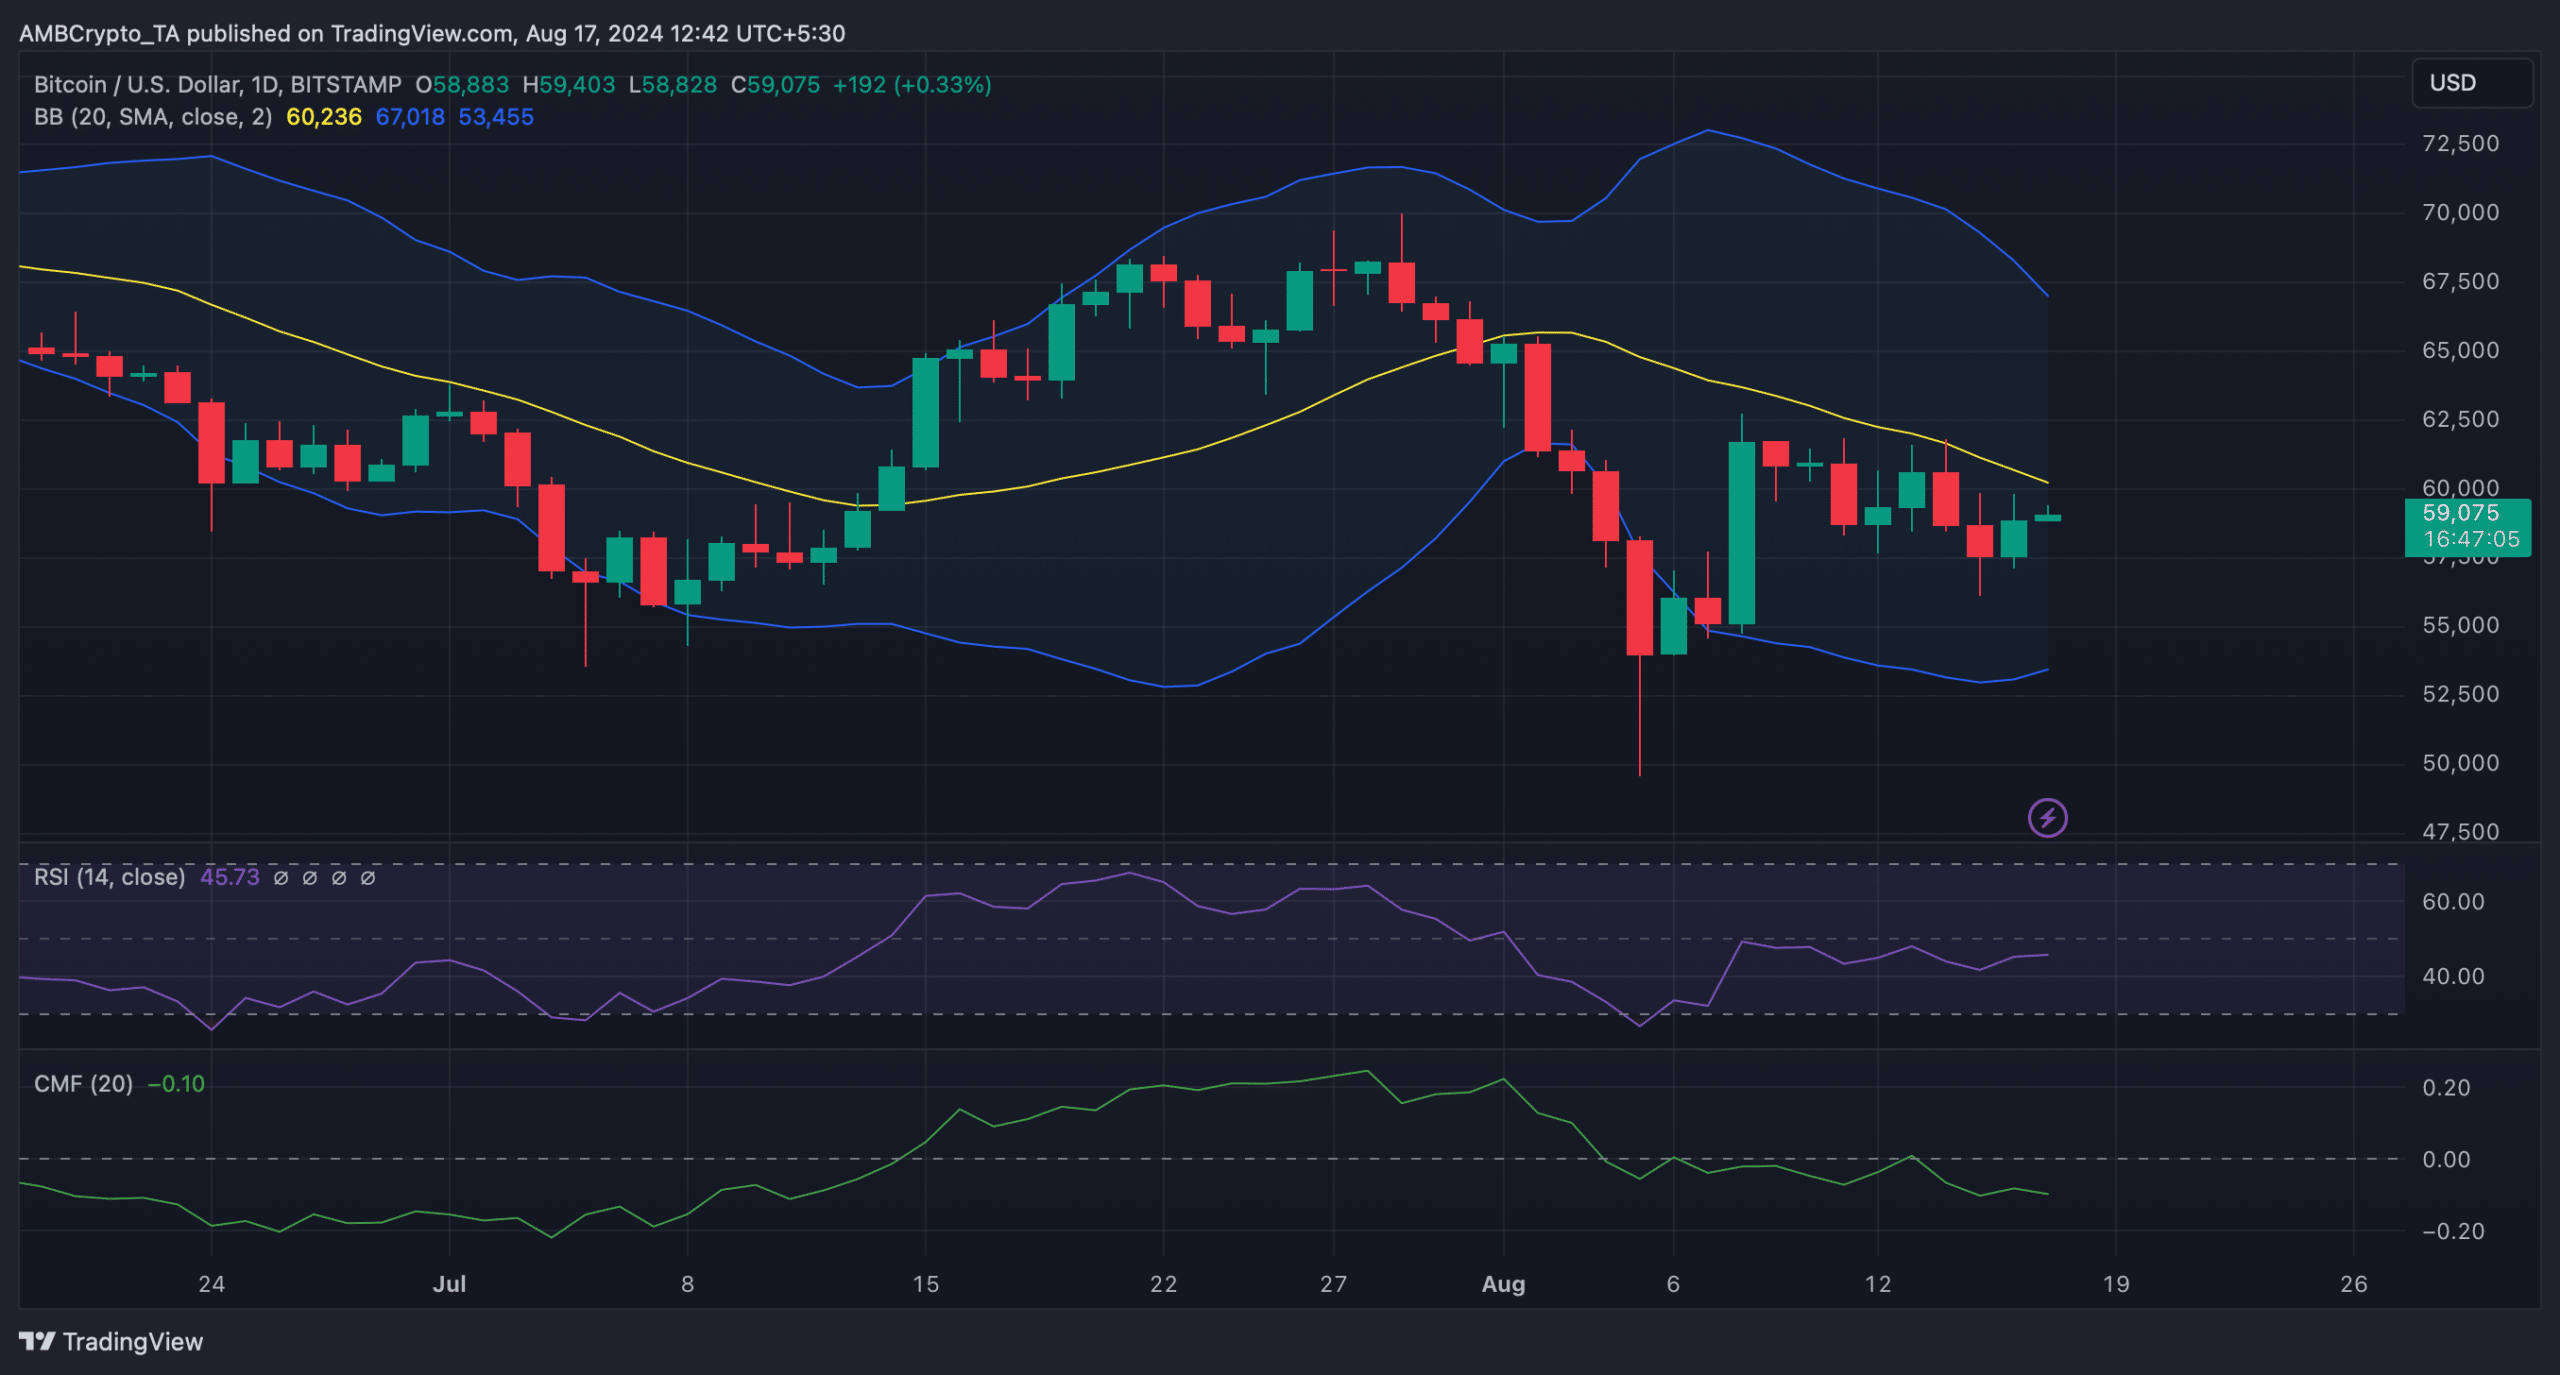
Source: TradingView


![Three days ago, Uniswap [UNI] attempted a breakout from a parallel channel, surging to hit a local high of $7.6. However, the altcoin faced strong rejection.](https://ambcrypto.com/wp-content/uploads/2025/06/Gladys-83-400x240.jpg)
