NOT, WIF face sharp sell-offs: A look at key market indicators
NOT and WIF are poised for further price declines as selling pressure continues to mount.

- The prices of NOT and WIF have declined in the last week.
- This has been due to a surge in profit-taking activity.
Notcoin [NOT] and dogwifhat [WIF] have shed their most recent gains. The two altcoins have witnessed double-digit price declines in the past seven days.
According to CoinMarketCap, NOT’s value dropped by 35%, while WIF’s price dipped by 21%. At press time, NOT exchanged hands at $0.016, and the memecoin WIF traded at $2.62.
NOT braces for more dip
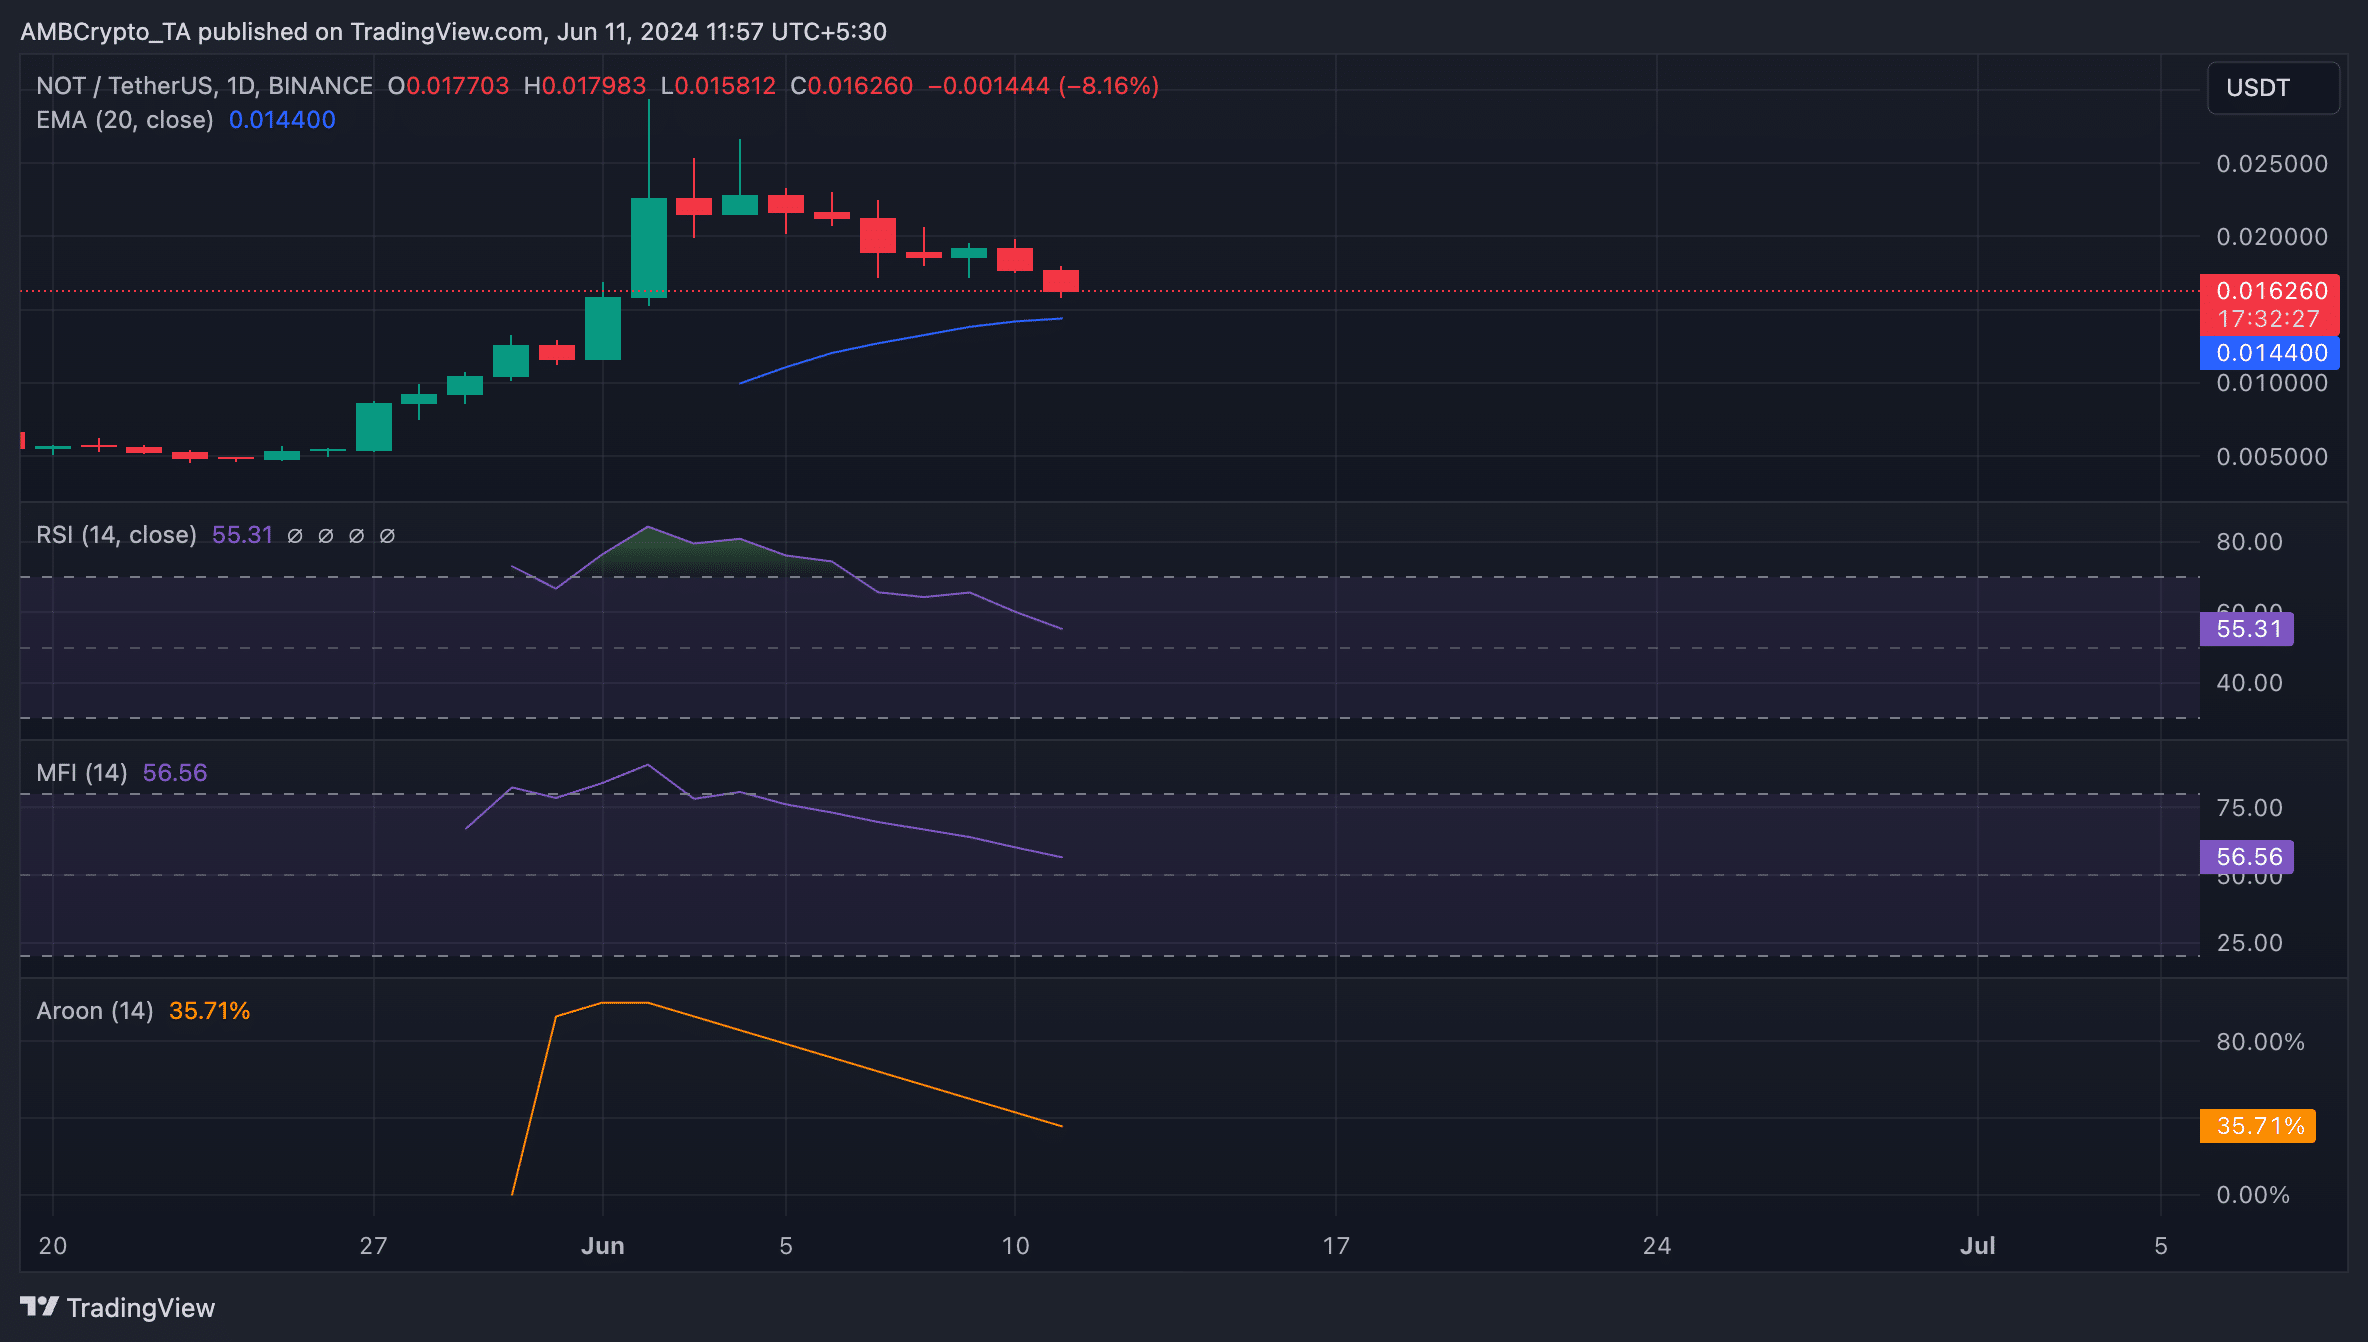
Following its launch on the Toncoin network on 16th May, NOT’s value climbed to a peak of $0.02 on 2nd June.
However, as profit-taking activity gained momentum, NOT bulls could not defend that price level, hence the price decline. At its current value, the altcoin’s price has dropped by 20% from its high.
An assessment of key momentum indicators confirmed the surge in NOT sell-offs in the past few days.
For example, its Relative Strength Index (RSI) and Money Flow Index (MFI) trended toward their respective center lines. At press time, the token’s RSI and MFI were 55.31 and 56.56, confirming the decline in buying pressure.
Further, the value of NOT’s Aroon Up Line (orange) was 35% at the time of writing. This indicator identifies the strength of an asset’s price trends and potential reversal points.
When an asset’s Aroon Up line is close to zero, the uptrend is weak, and the most recent high was reached a long time ago.
At its current price, NOT traded close to its 20-day exponential moving average (EMA), which tracks the token’s average price in the past 20 days.
When an asset trades close to this key moving average, it signals a decline in buying momentum and an indication that the bears might soon regain market control.
WIF sellers take charge
Regarding WIF, its performance has not been any different, as the bearish bias toward the leading meme coin remains significant.
For example, its Chaikin Money Flow (CMF) rested below the zero line to return a value of -0.09 at press time.
This indicator measures the flow of money into and out of the WIF market. When its value is negative, it signals liquidity outflow from the market, which is a bearish sign and a precursor to a further price decline.
Realistic or not, here’s NOT’s market cap in SOL terms
Also, readings from WIF’s Directional Movement Index (DMI) showed its positive directional index (green) resting below its negative index (red).
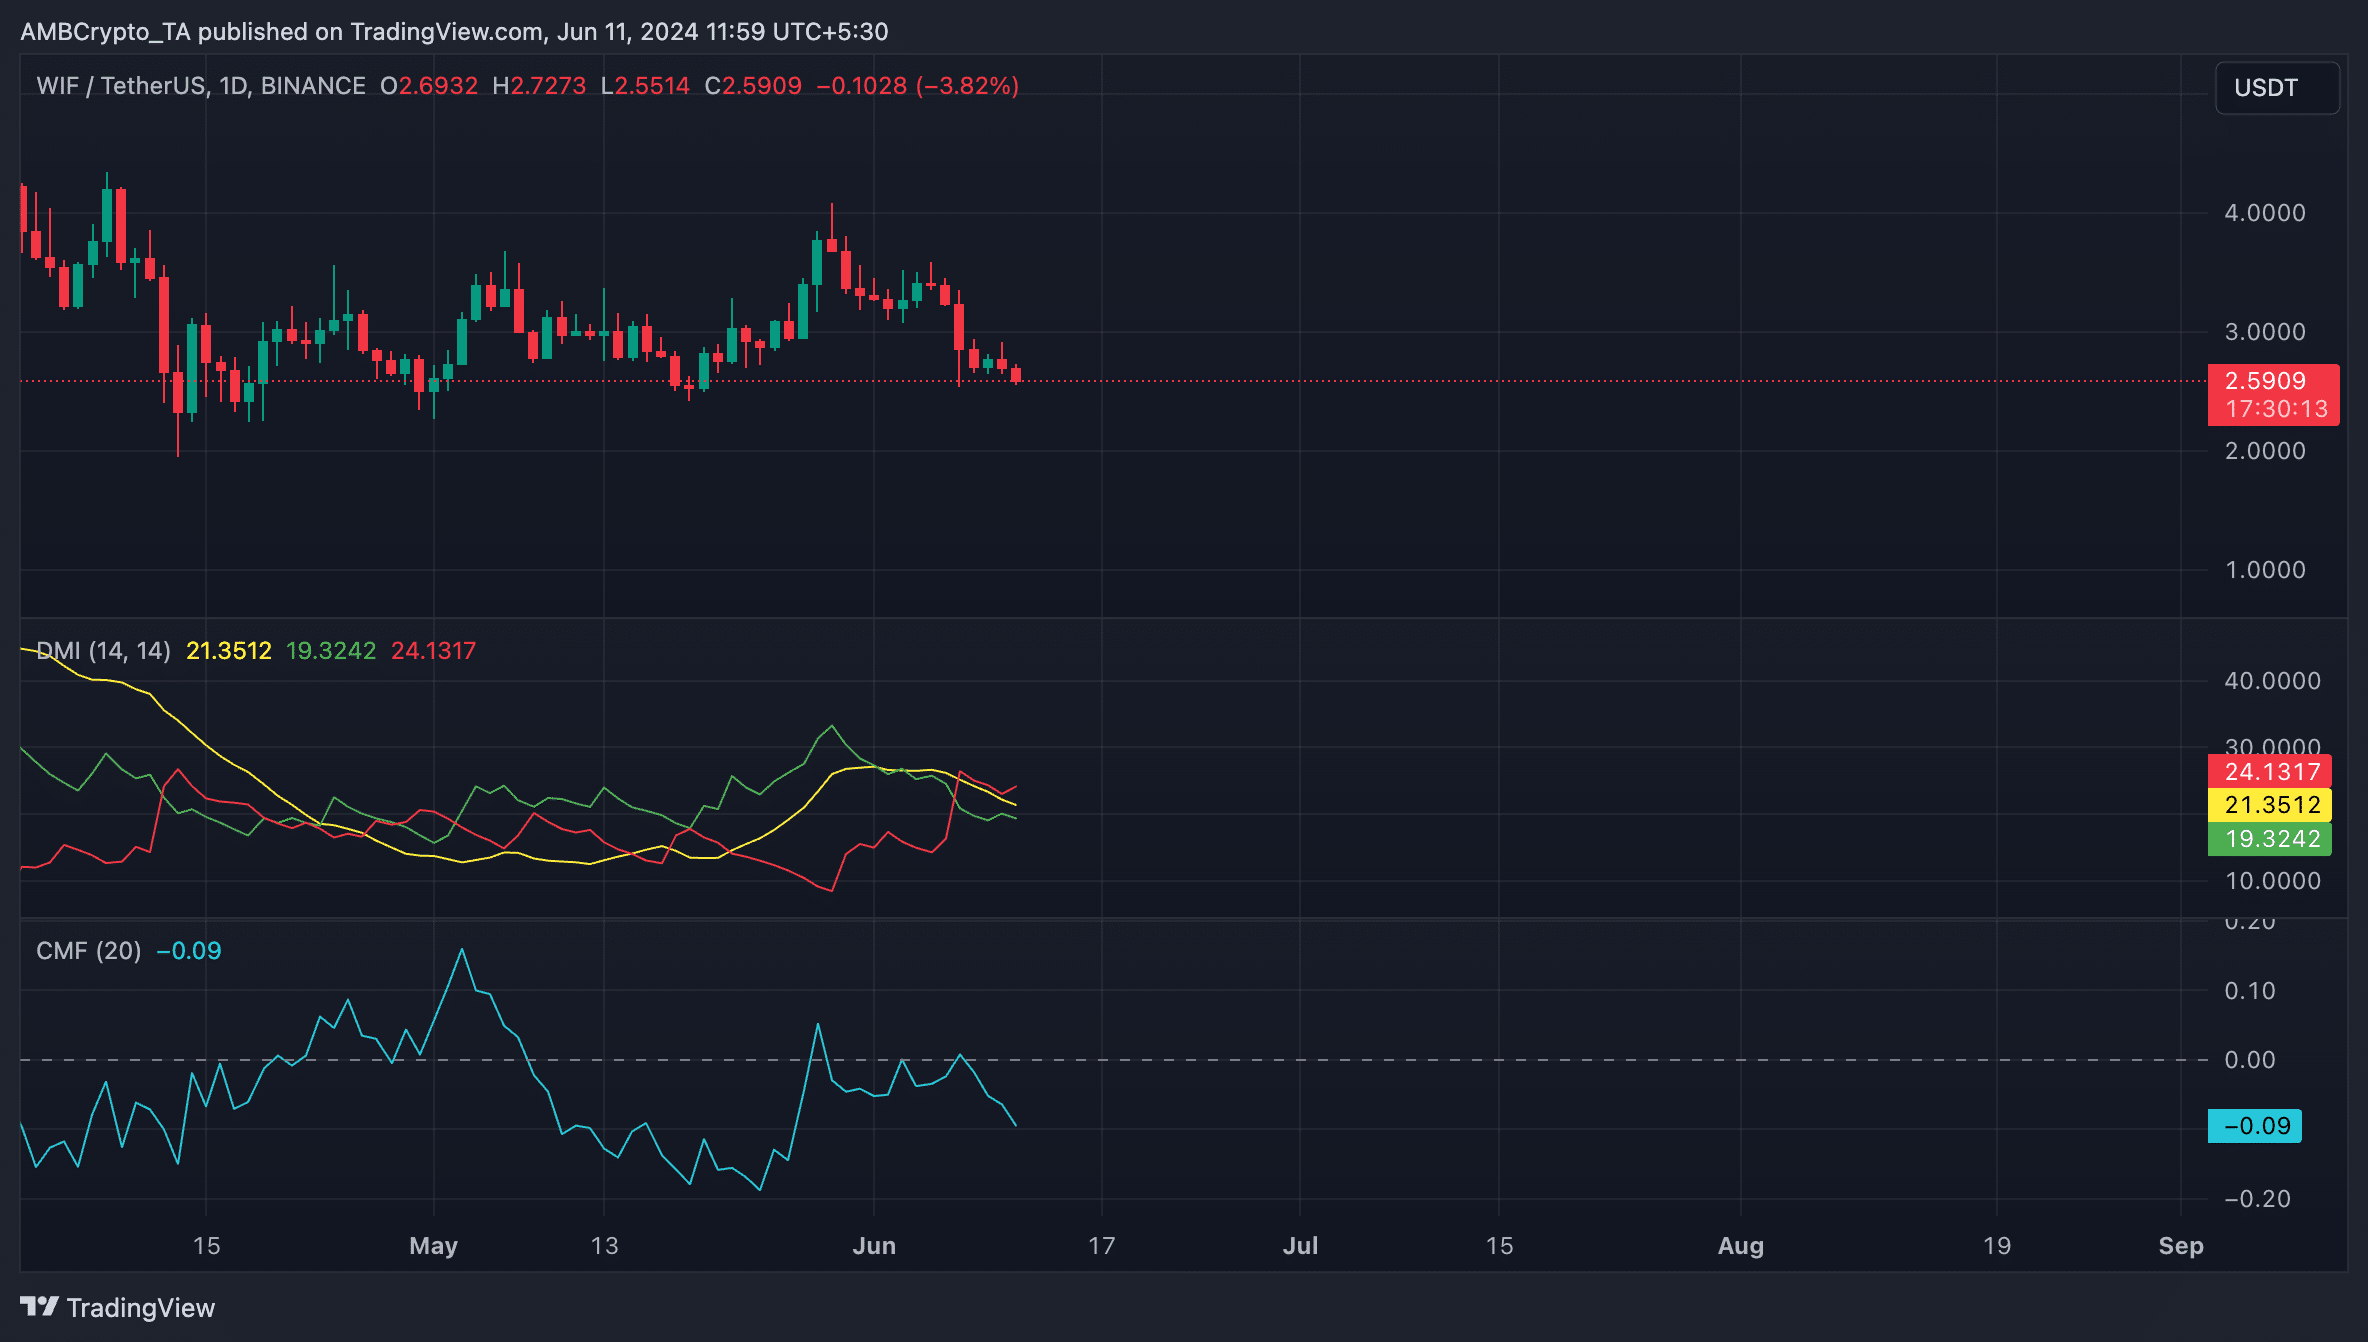
This means that bear strength is more significant than bull strength. It is interpreted as a signal that the sellers have market control.


