
- Notcoin bears dominated the market as the altcoin fell below its 20 and 50 EMA on its 4-hour chart.
- The altcoin’s Open Interest and long/short ratio reaffirmed bearish sentiment.
Notcoin [NOT] recently fell below its 20 and 50 EMA on the 4-hour chart after witnessing a strong bearish edge. Sellers renewed their pressure and forced a downtrend as NOT took a U-turn from its 0.02 resistance level.
If the buyers re-enter the market and guard the $0.129 support level, Notcoin could witness a bullish reversal in the short term. At press time, Notcoin traded near this support level.
Notcoin’s recent reversal formed a falling wedge
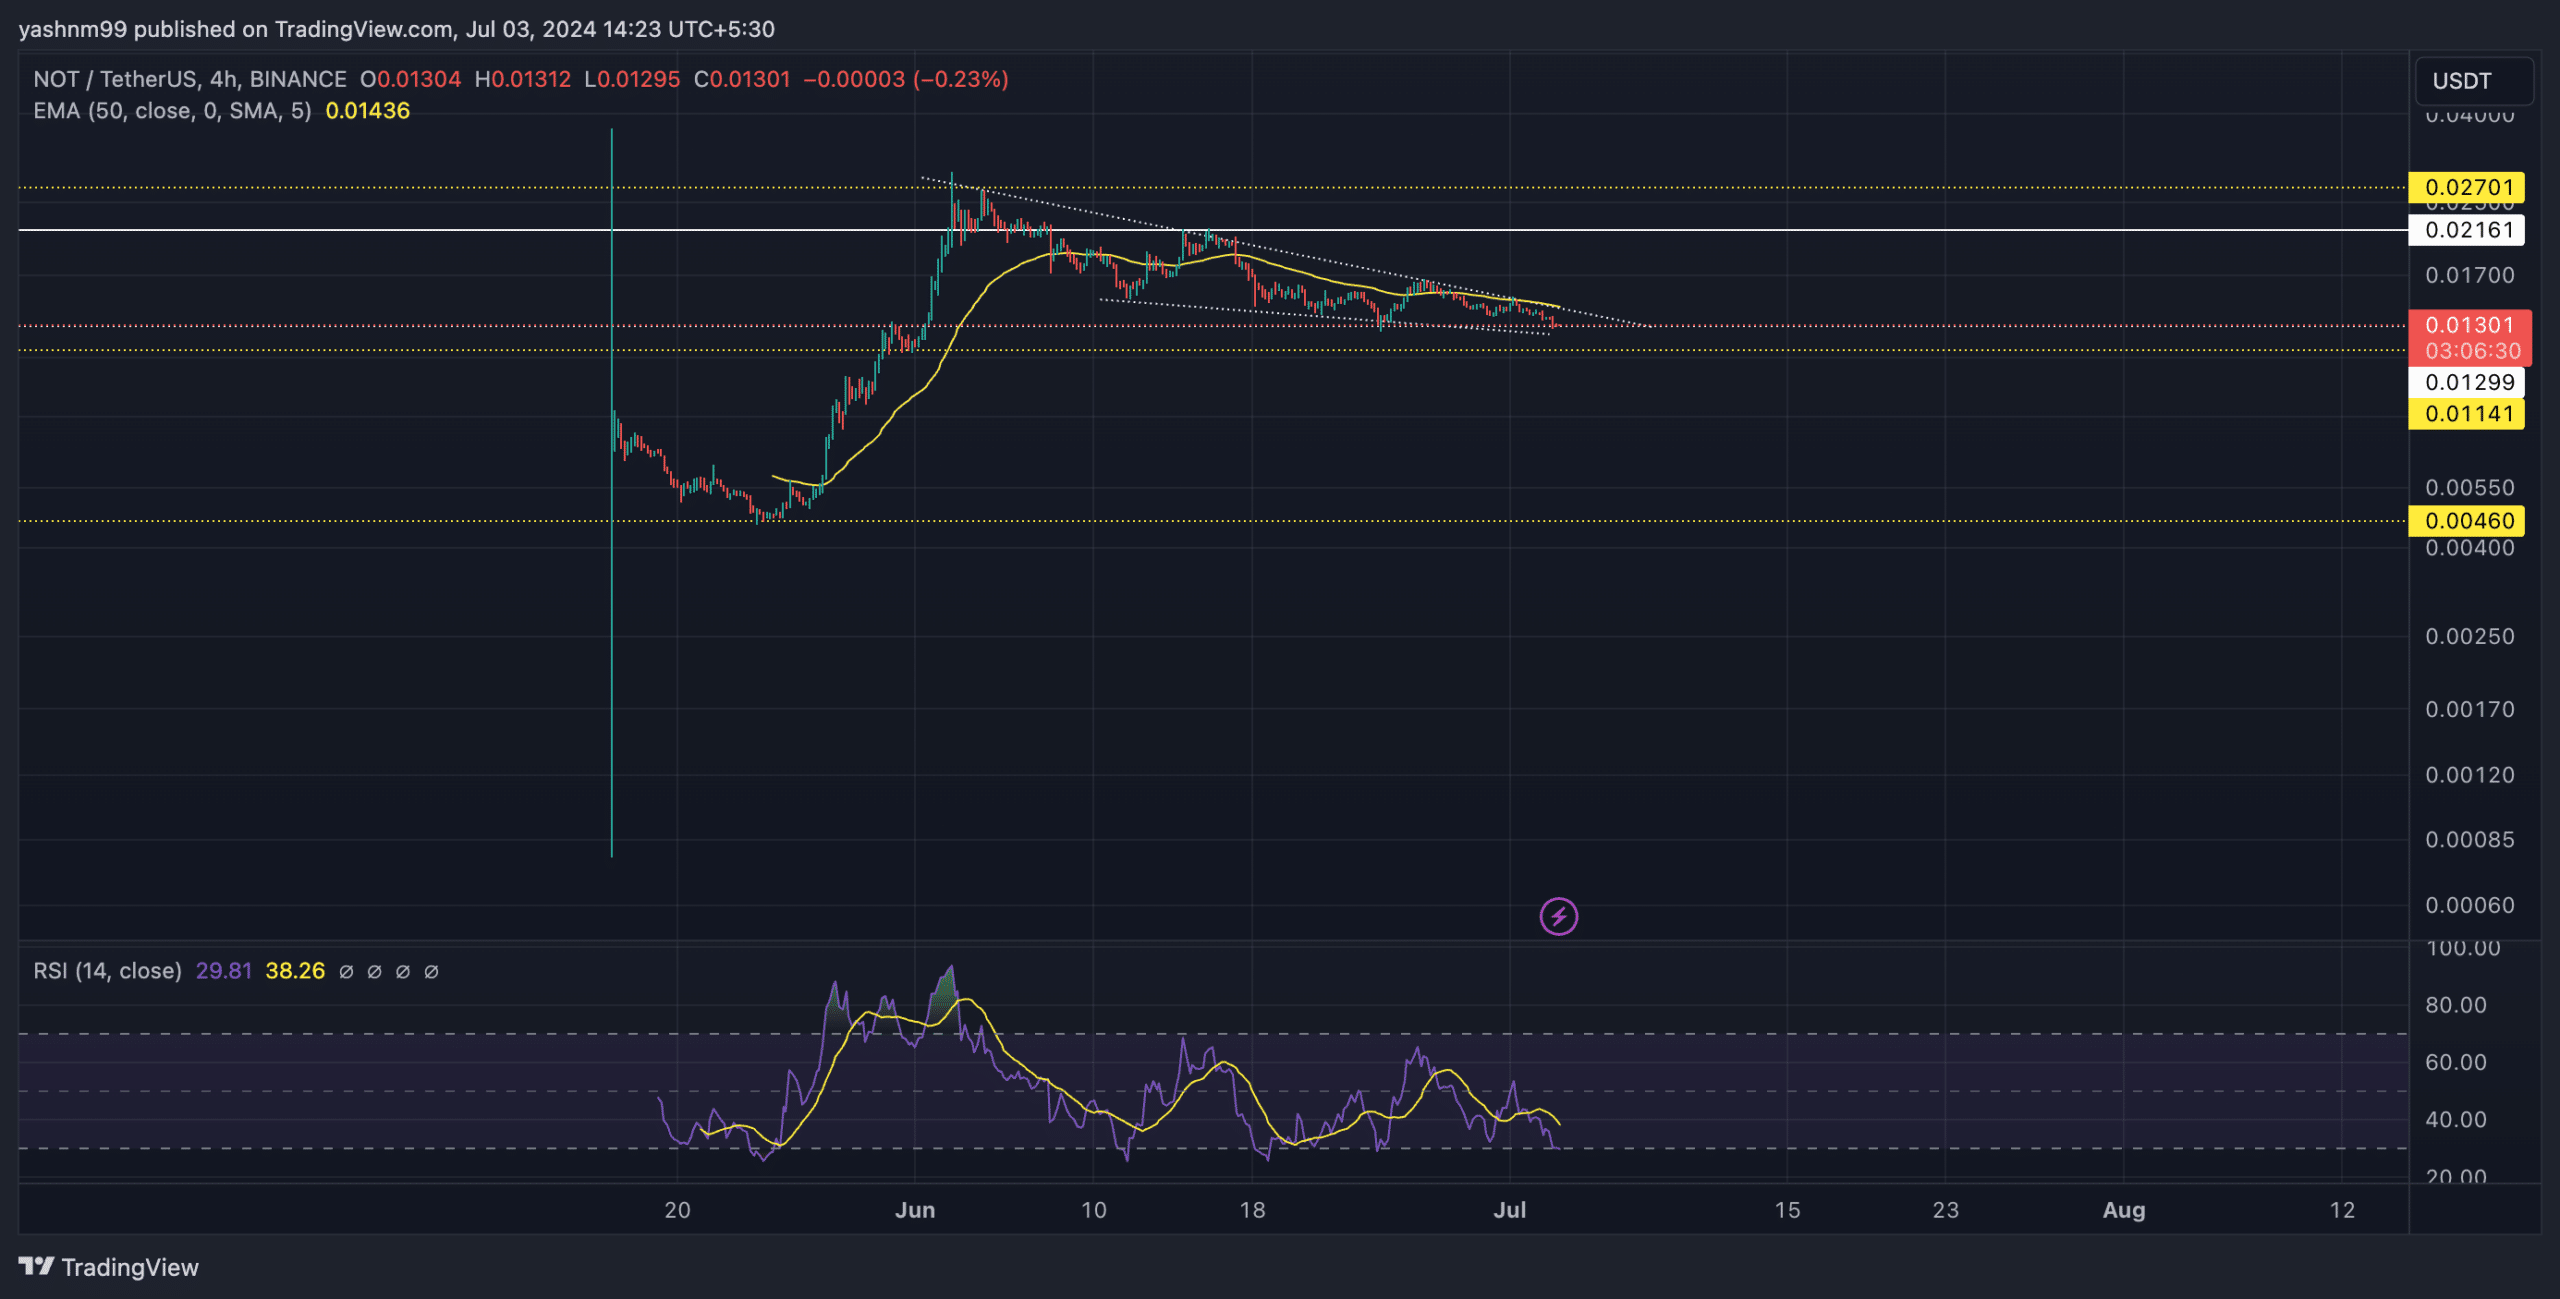
Source: TradingView, NOT/USDT
After rebounding from the $0.004 support level in May, NOT has witnessed a gradual uptrend. The alt was up by over 470% after bouncing back from this support when it reached an ATH of 0.029 on 2 June.
Notcoin saw a steep uptrend while marking a streak of green candles during this rally. However, the reversal from the $0.027 resistance set the stage for a month-long decline.
The price action saw an extended downtrend as it fell down to test the $0.11-$0.12 support range. The alt fell below its 20 and 50 EMA on the 4-hour chart, showing a strong bearish edge.
In the meantime, NOT price action formed a classic falling wedge pattern on its chart. Here, it’s worth noting that a steep uptrend preceded the falling wedge pattern. This is often an early sign of a bullish reversal.
However, the recent death cross on the 20/50 EMA can hamper the immediate recovery prospects. Buyers should wait for a close above the current falling wedge pattern to gauge the chances of an uptrend.
A potential close above the current pattern can help buyers test the $0.02 level in the coming weeks. On the other hand, a sustained close below the $0.129 level can position NOT for a near-term downtrend.
Here, the bears would aim to retest the $0.0114 mark.
The Relative Strength Index (RSI) was in the bearish zone after declining below its MA line. Any reversal from this overbought position can help confirm the bullish reversal bias.
Open Interest declining

Source: Coinglass
An analysis of the Open Interest showed a relatively favorable position for the sellers. NOT’s Open Interest across all exchanges was down by nearly 5% over the past day.
Realistic or not, here’s NOT’s market cap in BTC’s terms
This decline also coincided with the 24-hour price decrease of nearly 6%.
Also, the 24-hour long/short ratio on Coinglass indicated a value of around 0.88. This showed there are slightly more short positions than long positions and reaffirmed a bearish edge.