Analysis
Notcoin price prediction yields a warning for short-term traders – Details
Some of NOT’s indicators flashed very strong bearish signals on the charts.

- Notcoin is likely to fall towards the short-term range lows
- NOT swing traders could look for buying opportunities, but can wait for lower timeframe bullish sentiment before entering
It has been a good time for Notcoin [NOT] bulls. The breakout past the trendline resistance was maintained, but a range formation developed too. This can offer traders many opportunities, but investors need to exercise patience.
Notcoin’s price prediction is that in the coming days, swing traders can position themselves according to the range. In fact, analysis of data from the Futures market suggested that bullish conviction may be sorely lacking.
Good chance of a 5.6% price drop
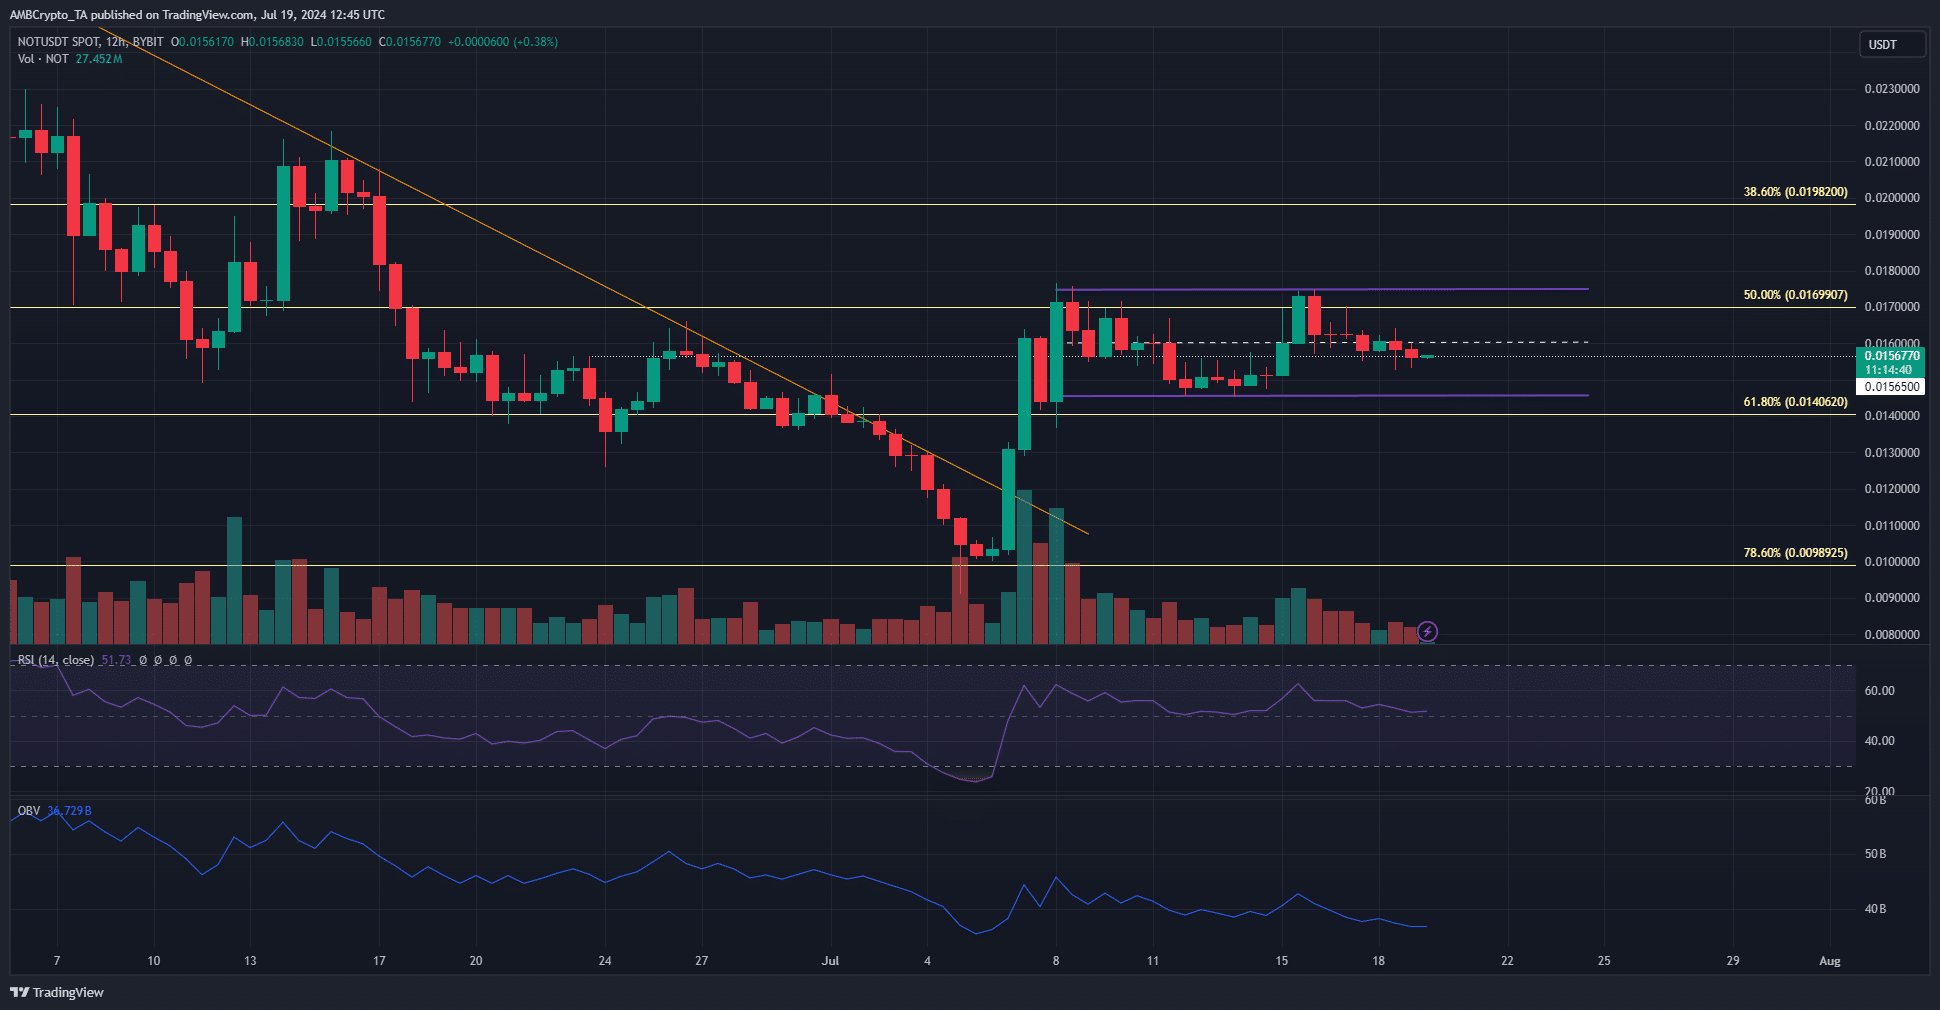
Highlighted in purple on the chart is a range formation that Notcoin has traded within since Monday, 8 July. It extended from $0.0145 to $0.0175 with the mid-range level at $0.16. This level was recently flipped to resistance.
At press time, the RSI was at 53 and barely hanging on to its perch above the neutral 50. Here, the inference would be that momentum was neutral but could see a negative swing, especially if the price falls below the $0.156-level.
Despite the breakout past the trendline resistance (orange) on 6 July, the OBV has done little to recover from the downtrend it has been on throughout July. This can be seen as another sign that buying pressure has been weak and short-term losses are likely.
Notcoin price prediction is bearish due to unenthusiastic buyers
Source: Coinalyze
While the funding rate was nominally positive, it did not signal bullishness over the last few days. The liquidations chart showed that the rejection from the range high three days ago witnessed a bunch of long liquidations.
Read Notcoin’s [NOT] Price Prediction 2024-25
Additionally, the Open Interest has been tepid after the move past the $0.014 resistance.
Finally, the strongest bearish signal was from the resolute downtrend of the spot CVD. According to this indicator, a move below $0.014 can be expected.
Disclaimer: The information presented does not constitute financial, investment, trading, or other types of advice and is solely the writer’s opinion.


