Analysis

OCEAN approaches $0.15 — will the lows see a positive reaction yet again?
Posted:
Journalist

Disclaimer: The findings of the following analysis are the sole opinions of the writer and should not be considered investment advice.
Like many altcoins in recent months, the token of Ocean Protocol [OCEAN] also formed a range and has traded within it since June. Bitcoin [BTC] does not have a bullish narrative over the next few weeks, although it could still make a move toward the $24k region.
Such a move upward would favor the altcoin market as well, including OCEAN. The price approached the range lows at press time and could soon offer a buying opportunity.
OCEAN- 12-Hour Chart
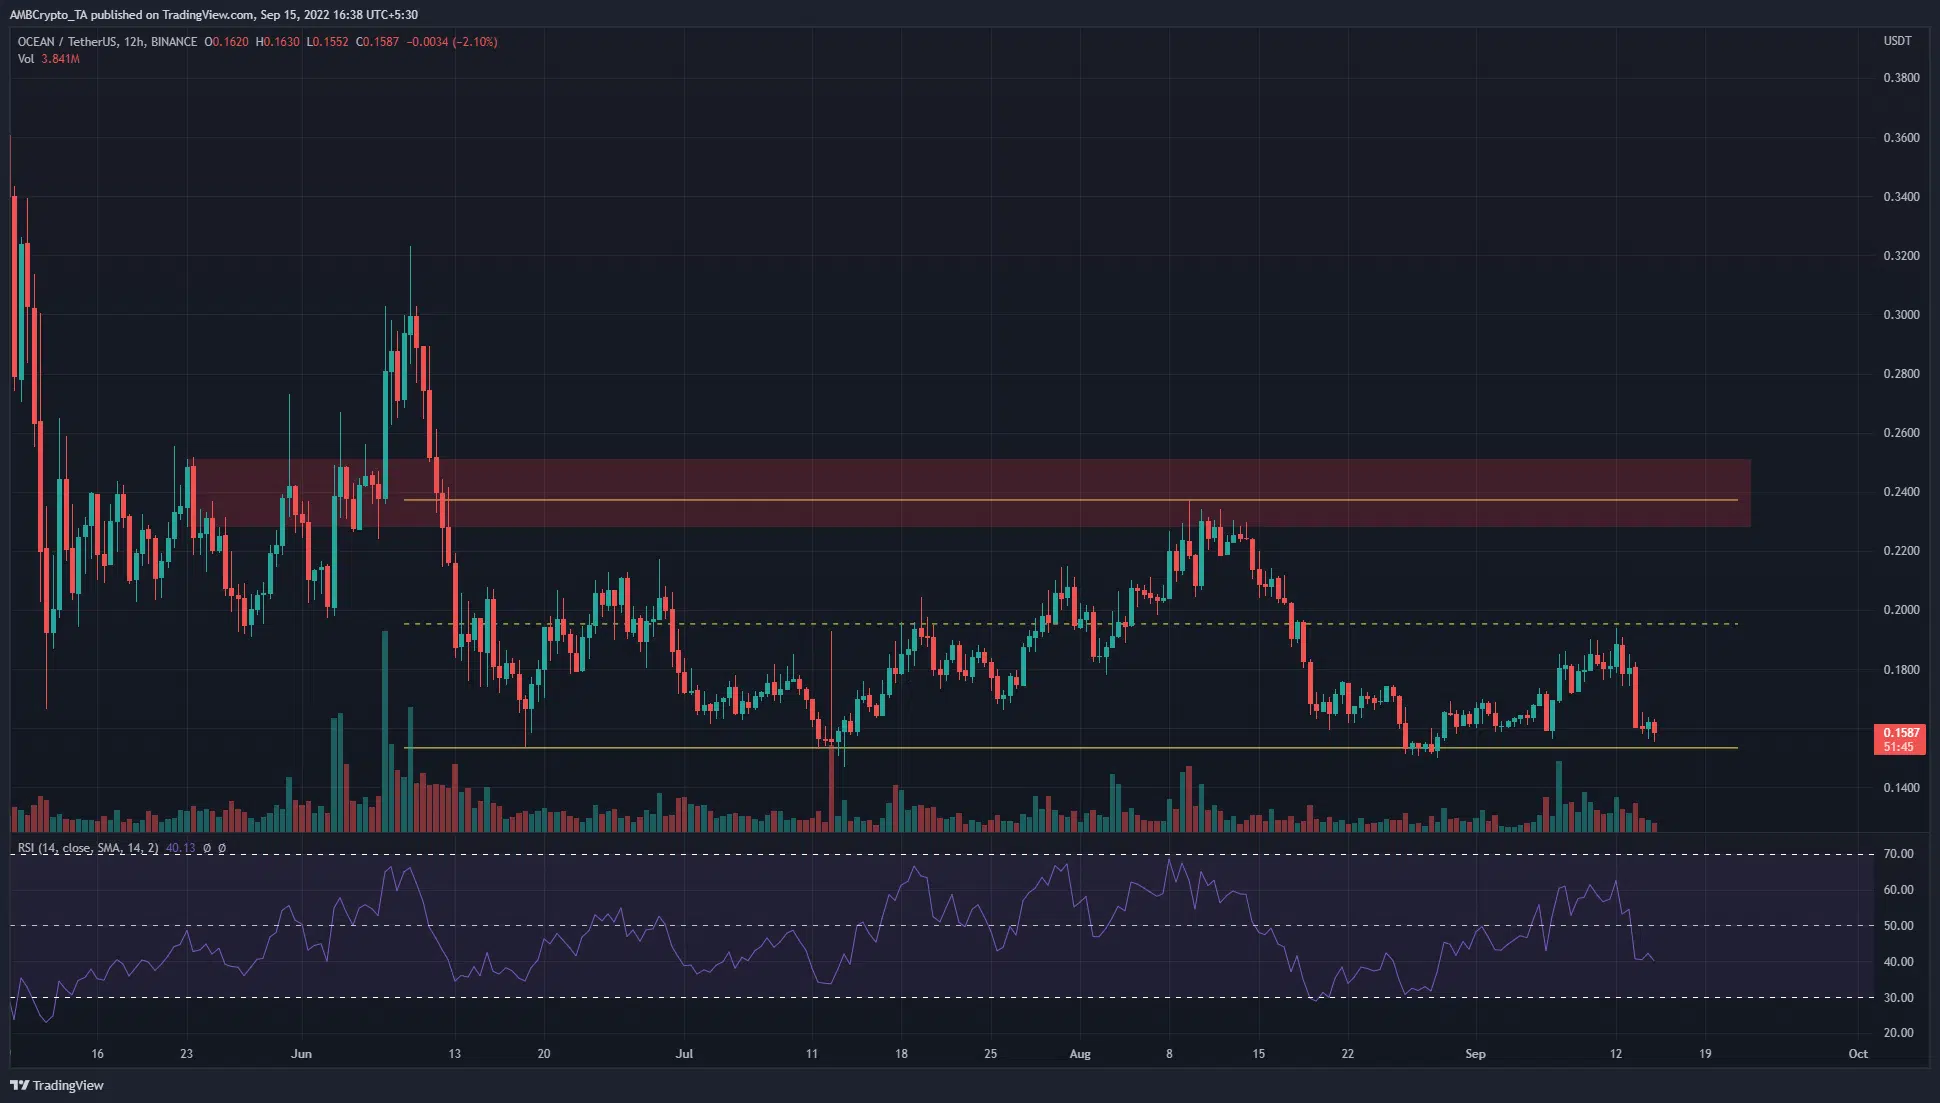
Source: OCEAN/USDT on TradingView
The trend is a trader’s friend, and ranges can be as well. OCEAN formed a range (yellow) from $0.2375 to $0.1536 with the mid-range at $0.195. Since June, the price has traded within this range, and the mid-point has been respected as significant support and resistance.
On the 12-hour chart it can be seen that a bearish order block (red box) formed in May. This candle saw bearish subsequent trading sessions that broke the market structure and flipped it to bearish. In June, after breaking above this zone, OCEAN was able to close a session as high as $0.3. However, it quickly retraced all those gains to fall to the range lows.
Going forward, buying at the range lows could be the play. Invalidation can also be easily defined, especially on lower timeframes.
OCEAN- 2-Hour Chart
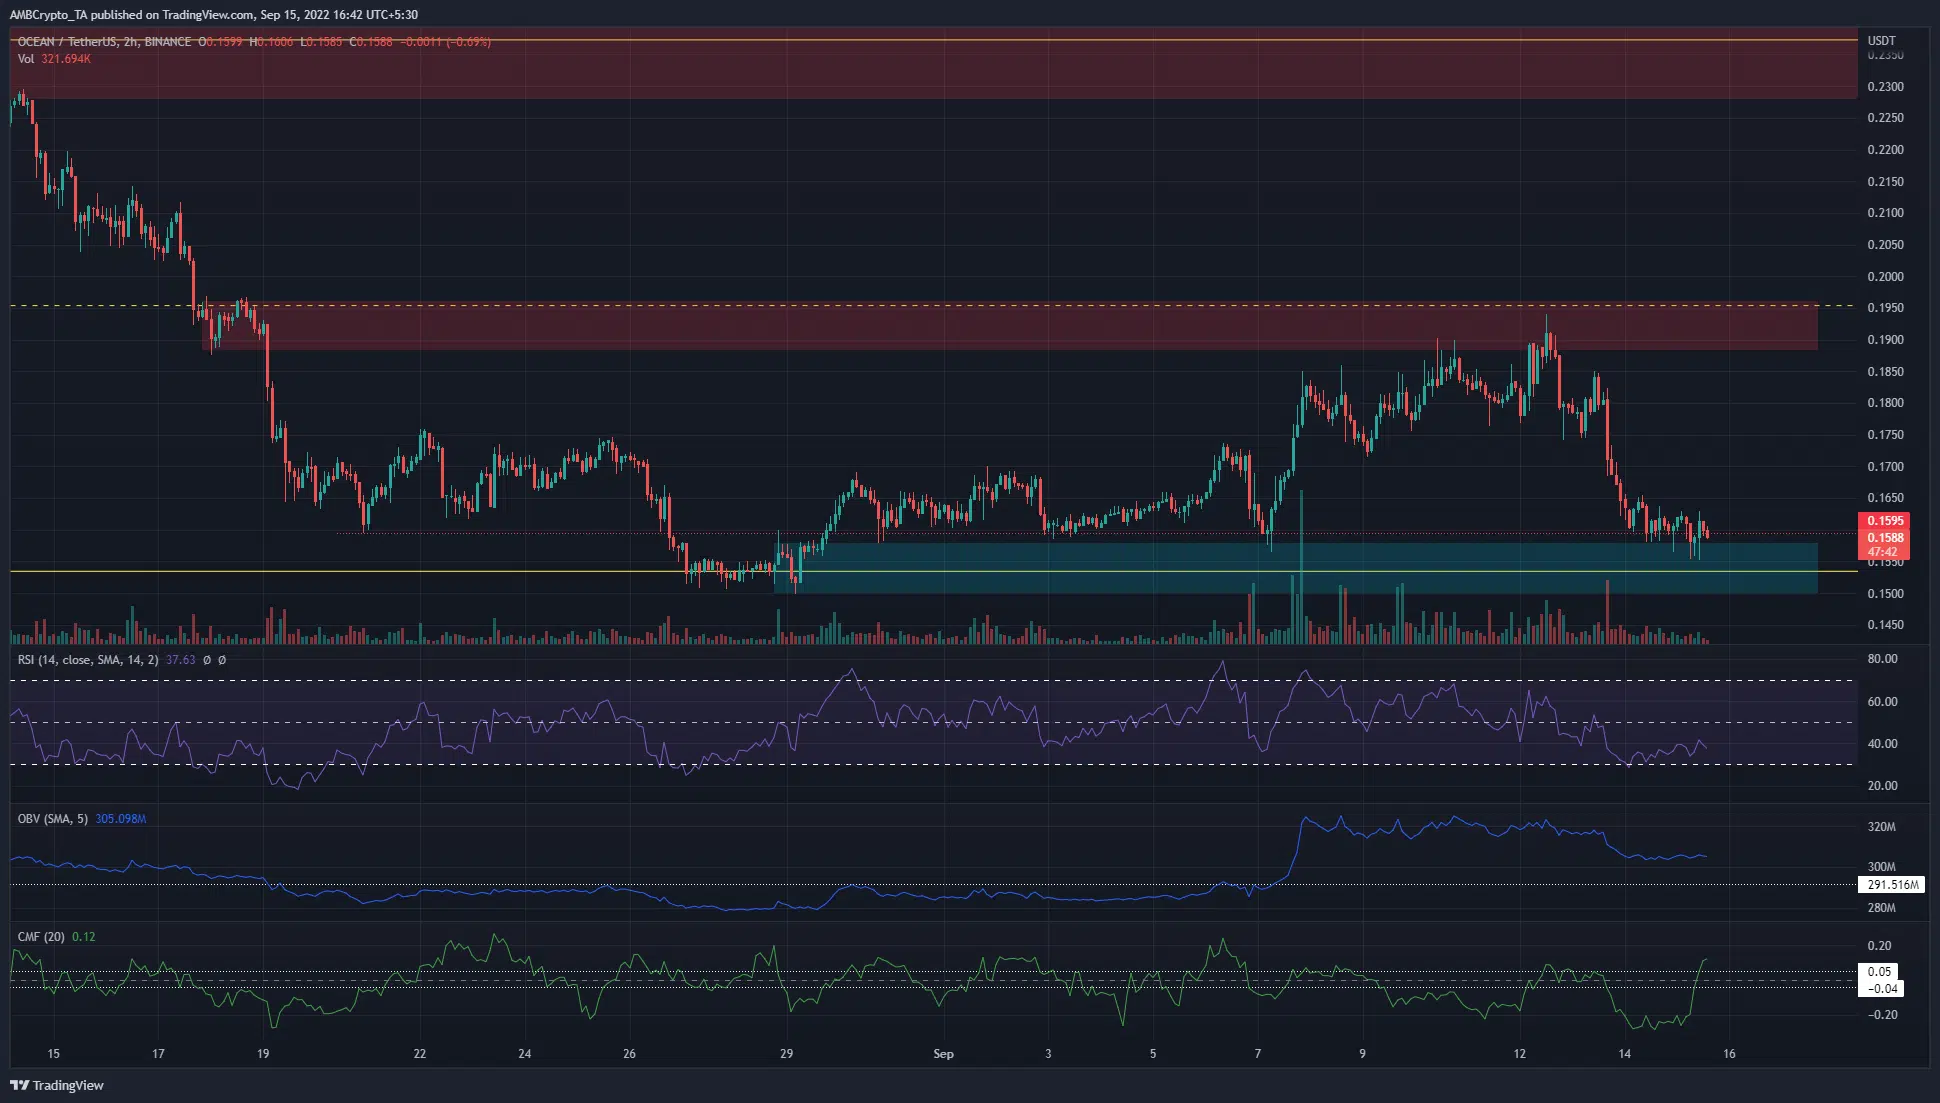
Source: OCEAN/USDT on TradingView
Similar to the previous bearish order block, another zone of supply was seen at $0.19-$0.195. Marked by the red box, it showed a former support zone from August that has since been flipped to resistance. Moreover, this area has confluence with the mid-range point, making it a stronger resistance zone.
On the other side, a demand zone was identified near $0.15 and highlighted by the cyan box. This demand zone also has confluence with the range low at $0.153. The Relative Strength Index (RSI) slipped below neutral 50 to highlight bearish dominance in the past couple of days.
Yet, even though the RSI was in decline, the On-Balance Volume (OBV) witnessed a significant uptick in September. Over the past week, the OBV too declined marginally. Despite this dip, it still showed healthy buying pressure in the past ten days.
The Chaikin Money Flow (CMF), on the other hand, stayed below or at neutral territory in the same time period to show significant capital outflow from the market.
Conclusion
The daily as well as the two-hour chart showed bearish momentum, although the bottom of the range was imminent. A dip toward $0.15 would offer a buying opportunity with a stop-loss at or below $0.147.
Near-term resistance at $0.175, as well as the $0.195 mid-range can be used to take-profit. A daily session close below $0.149 could invalidate the idea of a bounce.


![Why Chainlink [LINK] and Polygon [MATIC] are more similar than you realise](https://ambcrypto.com/wp-content/uploads/2024/04/Chainlink_and_Polygon-1-400x240.webp)

