Odds of Ethereum experiencing another price correction are…

- Ethereum’s exchange reserve increased which meant it was reeling under selling pressure.
- Most of the market indicators were bearish, but a few metrics supported the bulls.
After crossing the $1,900 mark, Ethereum [ETH] once again witnessed price corrections as its value declined. Interestingly, a tweet from Lookonchain pointed out that whales were selling their ETH holdings. This could be detrimental for ETH as it can result in a further price plummet.
Read Ethereum’s [ETH] Price Prediction 2023-24
Whale confidence declines
CoinMarketCap’s data revealed that ETH’s price declined by more than 4% in the last seven days. At the time of writing, it was trading at $1,839.66 with a market capitalization of over $221 billion. The price decline was accompanied by a double digit drop in 24-hour trading volume.
Things can turn even sour as Lookonchain’s tweet pointed out that a whale with an exceptional track record recently deposited ETH worth nearly $50 million to Binance. Against the deposit, the whale withdrew 15.9 million USDT.
Over the past years, this particular whale has always bought ETH at low prices and sold the token, earning profits, which were followed by ETH price corrections. Therefore, Ethereum’s price decline seemed possible.
Ethereum faces high selling pressure
As per CryptoQuant, ETH’s exchange reserve was increasing. An uptick in the metric means that investors were selling their holdings, which is a bearish signal.
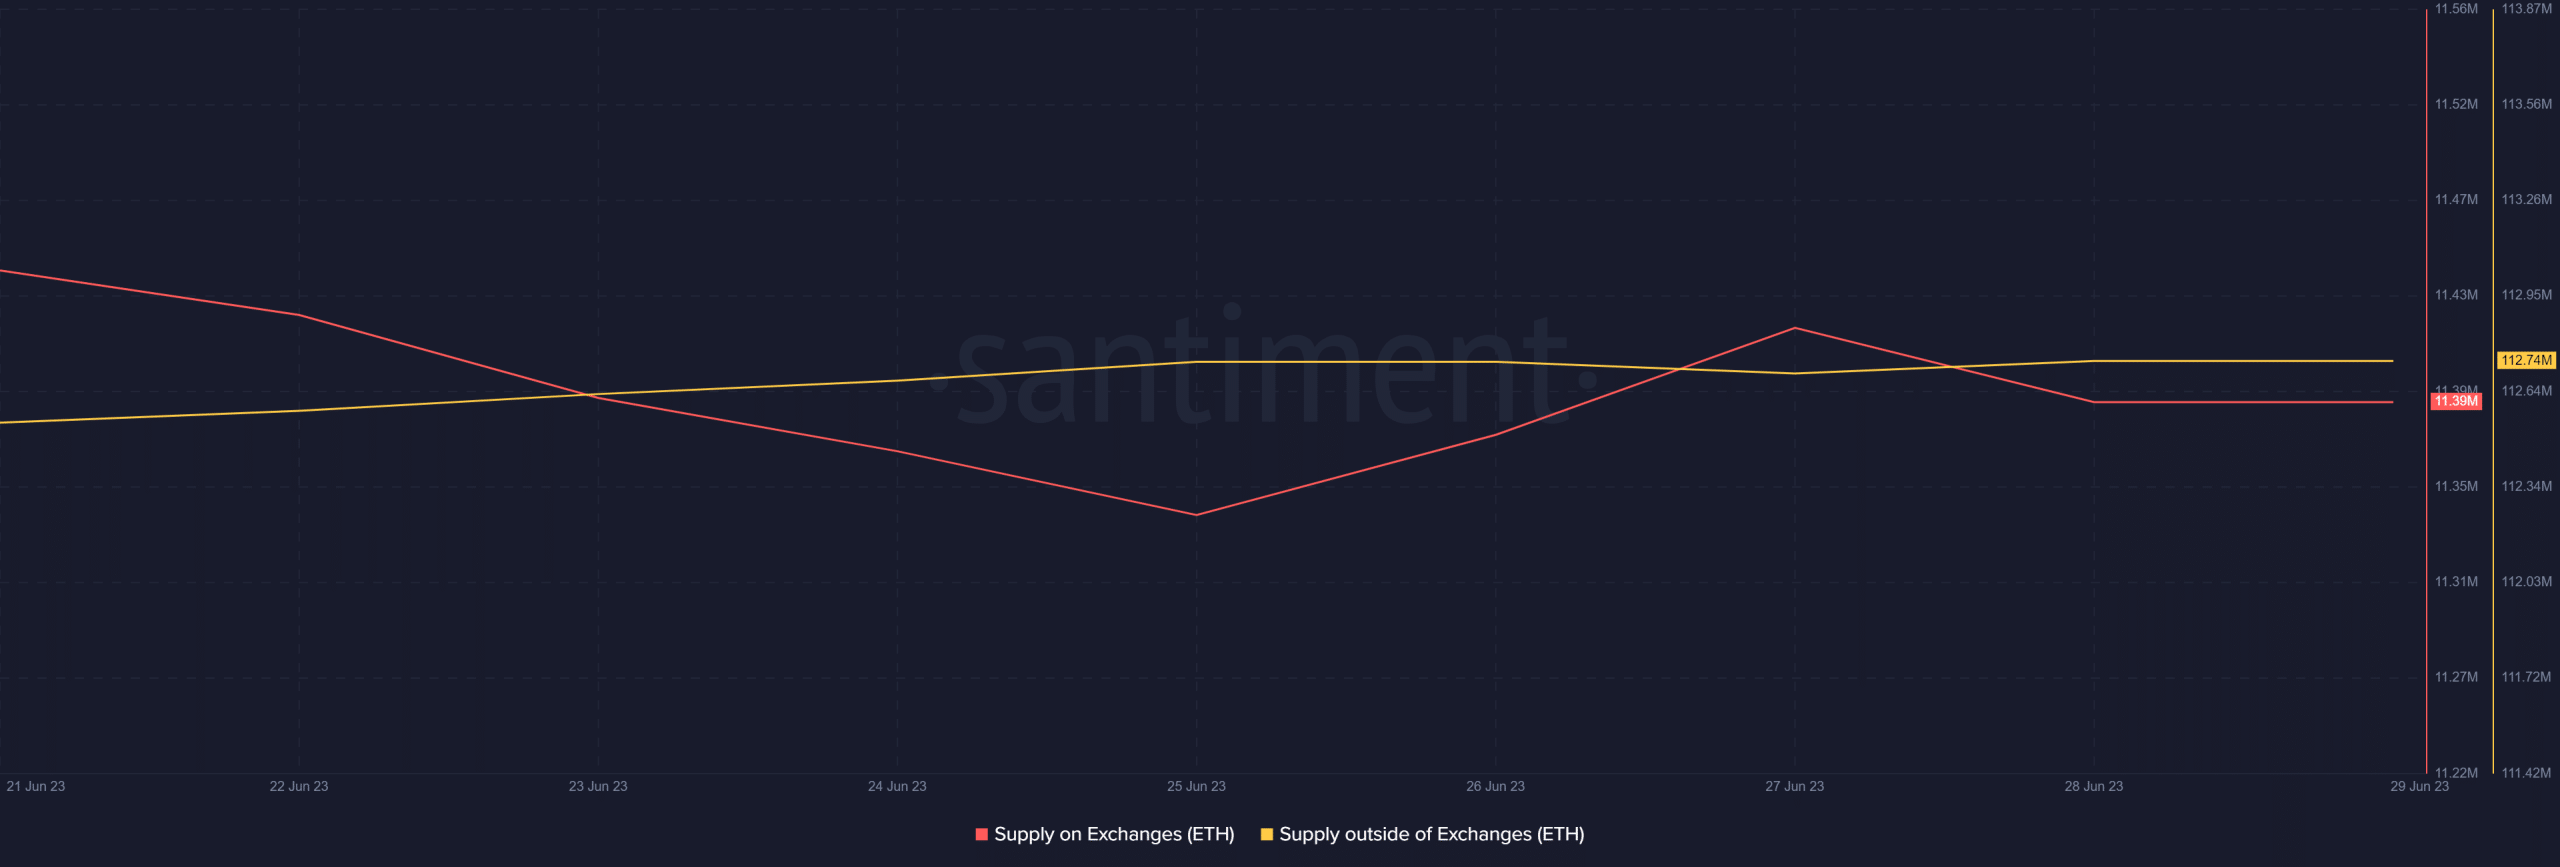
Santiment’s chart revealed that Ethereum’s supply on exchanges and supply outside of exchanges were also close to each other, which looked bearish as there was a possibility of the former flipping the latter in the coming days.
Sellers might step up their game soon
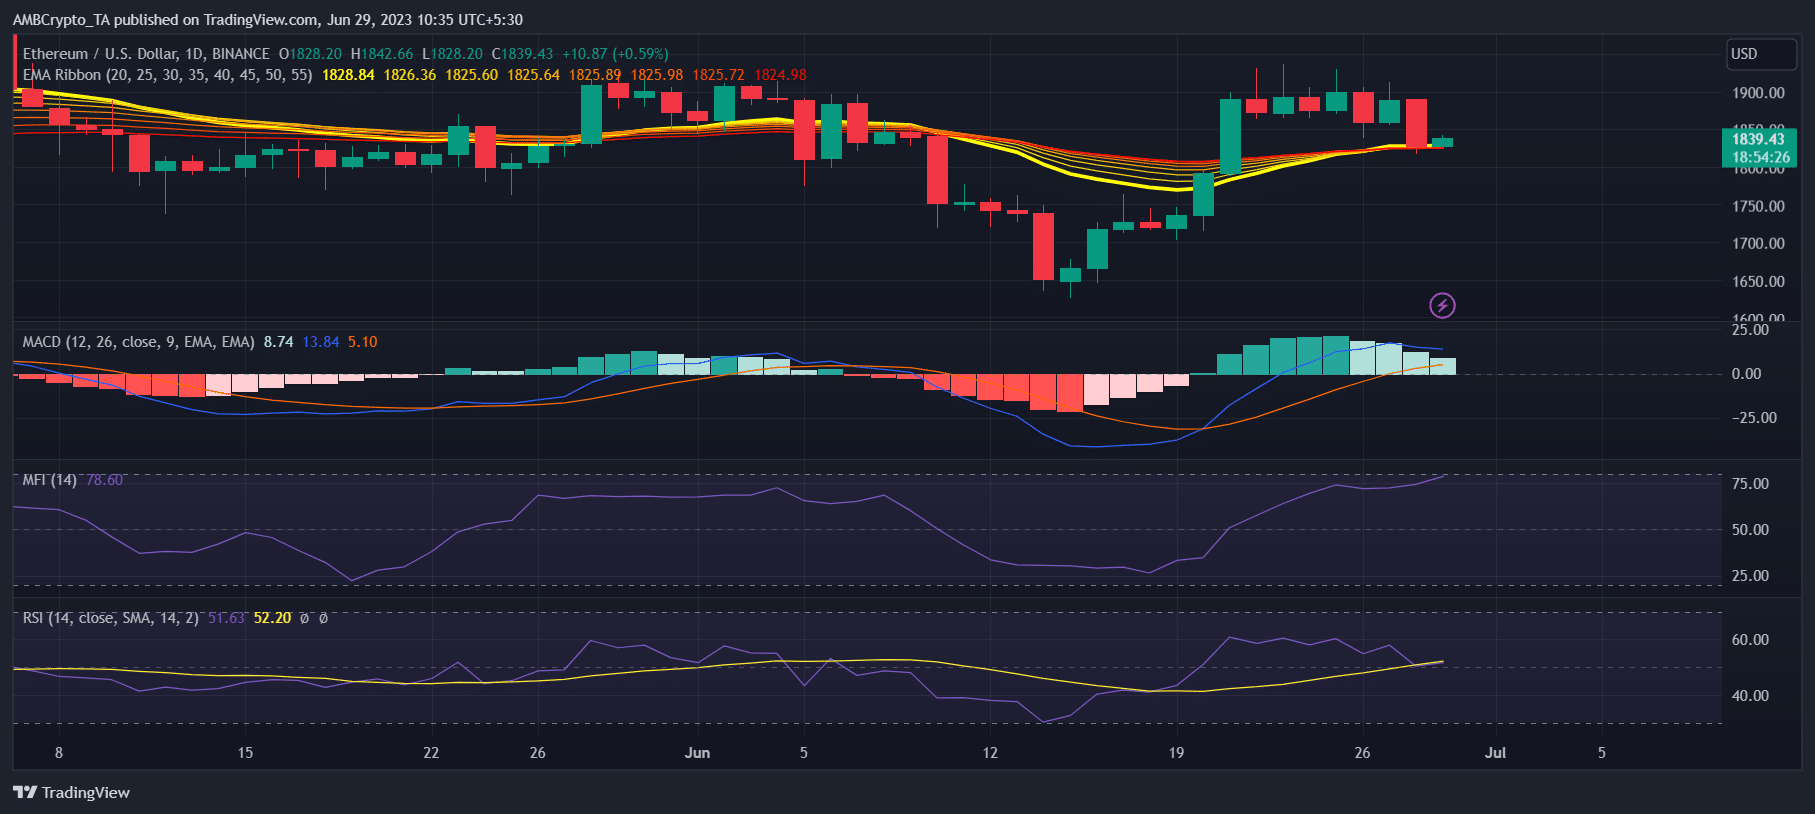
A look at Ethereum’s daily chart revealed quite a few metrics that supported the bears. For instance, the Money Flow Index (MFI) was about to enter the overbought zone. ETH’s Relative Strength Index (RSI) registered a downtick. Additionally, the MACD displayed the possibility of a bearish crossover, increasing the chances of a continued downtrend.
Interestingly, the Exponential Moving Average (EMA) Ribbon chose to support the buyers as it displayed a bullish crossover.
Is your portfolio green? Check the Ethereum Profit Calculator
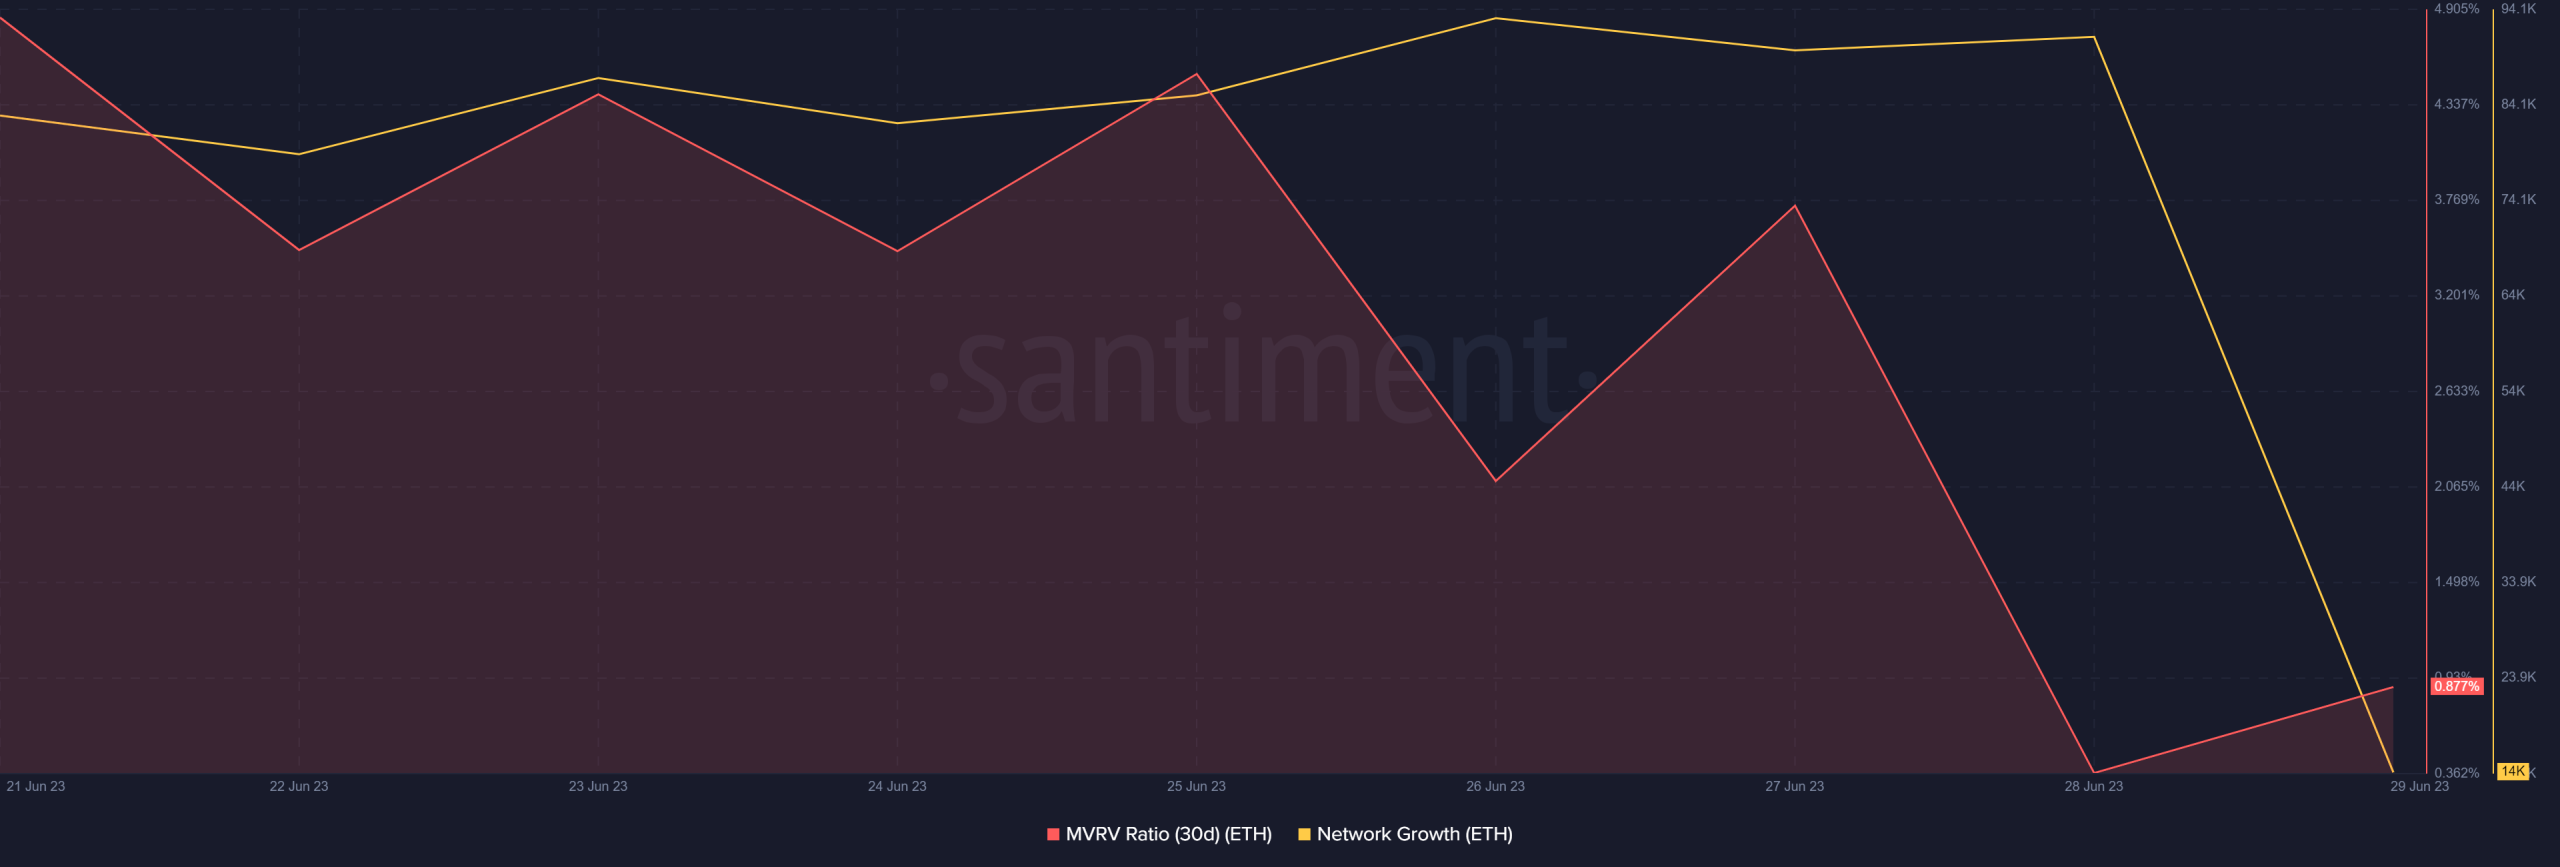
Like the EMA Ribbon, a few of the on-chain metrics looked bullish. As per CryptoQuant, ETH’s taker buy/sell ratio was green. The metric suggested that buying sentiment was dominant in the derivatives market. At the same time, ETH’s network growth also remained high.
However, nothing can be said with utmost certainty as Ethereum’s MVRV Ratio was down substantially, which was bearish.


![Bonk Coin [BONK]](https://ambcrypto.com/wp-content/uploads/2025/06/Gladys-19-1-400x240.webp)


